August 22, 2025 a 03:32 pm

REG: Dividend Analysis - Regency Centers Corporation
The analysis of Regency Centers Corporation reveals a robust dividend profile with a stable history and a respectable yield. Despite a high payout ratio, the cash flow metrics suggest sufficient room for maintaining its dividend. However, attention should be directed toward the moderate growth indicators and the company's attempts to strengthen its balance sheet.
📊 Overview
Regency Centers Corporation is situated in the REIT sector, known for providing substantial income to investors. The company's dividend yield of 3.96% appears attractive, supported by its current dividend per share of $2.79 USD. With an impressive 32 years of dividend history and no recent cuts or suspensions, the company showcases a stable commitment to shareholders.
| Metric | Details |
|---|---|
| Sector | REIT |
| Dividend yield | 3.96% |
| Current dividend per share | $2.79 USD |
| Dividend history | 32 years |
| Last cut or suspension | None |
🗣️ Dividend History
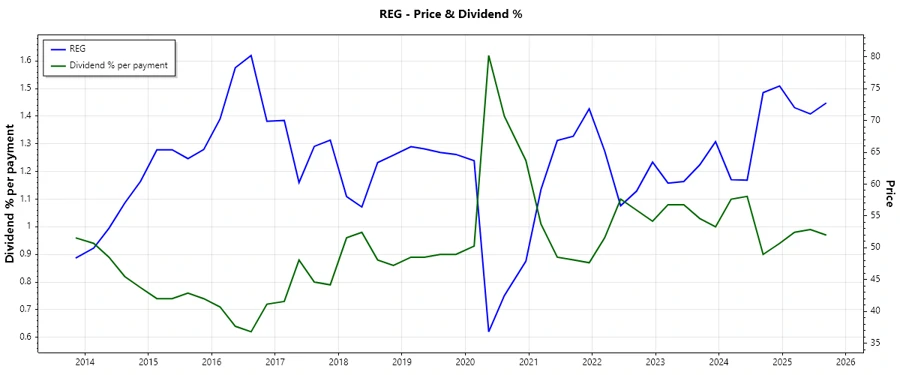
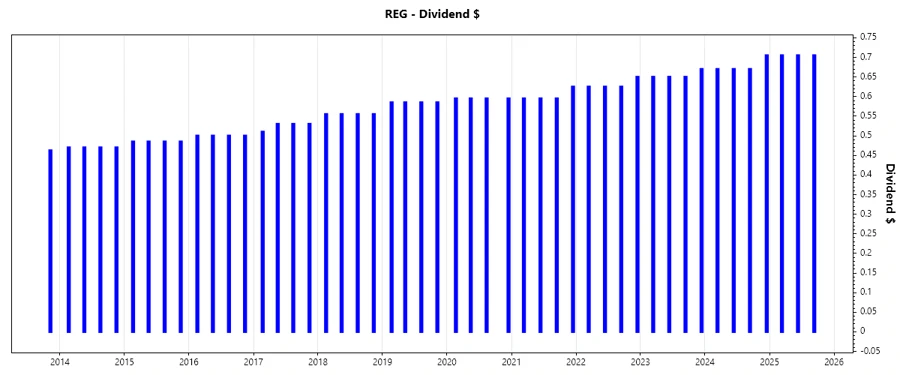
The extended dividend history of Regency Centers Corporation underlines its reliability in consistent shareholder returns. A maintained and rising dividend over the years serves as a significant indicator of the firm’s commitment to its shareholders and its financial health.
| Year | Dividend Per Share (USD) |
|---|---|
| 2025 | $2.12 |
| 2024 | $2.72 |
| 2023 | $2.62 |
| 2022 | $2.53 |
| 2021 | $2.41 |
📈 Dividend Growth
The ability of Regency Centers Corporation to grow its dividend is crucial for attracting income-focused investors. The average dividend growth rate over five years stands at 3.02%, indicating moderate progression.
| Time | Growth |
|---|---|
| 3 years | 4.05% |
| 5 years | 3.02% |
The average dividend growth is 3.02% over 5 years. This shows moderate but steady dividend growth.
✅ Payout Ratio
The payout ratio is instrumental in assessing the sustainability of a dividend. Regency Centers Corporation exhibits an EPS-based payout ratio of 125.54% and a FCF-based payout ratio of 68.39%, suggesting that dividends currently exceed earnings, yet are comfortably covered by cash flow.
| Key Figure | Ratio |
|---|---|
| EPS-based | 125.54% |
| Free cash flow-based | 68.39% |
The EPS-based payout ratio over 100% urges caution, but the lower FCF ratio indicates dividends are still sustainably maintained through operational cash flows.
🔍 Cashflow & Capital Efficiency
Effective capital management and cash flow generation are paramount for sustaining dividends. Regency has demonstrated healthy cash flow yields and operational efficiency, bolstered by modest capital expenditures.
| Metric | 2024 | 2023 | 2022 |
|---|---|---|---|
| Free Cash Flow Yield | 5.91% | 6.10% | 6.17% |
| Earnings Yield | 2.99% | 3.09% | 3.19% |
| CAPEX to Operating Cash Flow | 0% | 0% | 0.75% |
| Stock-based Compensation to Revenue | 1.62% | 1.52% | 1.35% |
| Free Cash Flow / Operating Cash Flow Ratio | 100% | 100% | 100% |
The metrics reflect a robust cash generation capability and efficient capital deployment, essential for enduring dividend payouts and reinvestment opportunities.
📉 Balance Sheet & Leverage Analysis
Analyzing leverage ratios and balance sheet health helps gauge Regency's financial resilience. The company's leverage remains controlled, though there is scope for improvement, particularly in its debt management.
| Metric | 2024 | 2023 | 2022 |
|---|---|---|---|
| Debt-to-Equity | 74.63% | 68.23% | 64.63% |
| Debt-to-Assets | 40.50% | 38.61% | 36.28% |
| Debt-to-Capital | 42.74% | 40.56% | 39.26% |
| Net Debt to EBITDA | 4.99 | 6.04 | 4.06 |
| Current Ratio | 0.73 | 0.46 | 0.81 |
| Quick Ratio | 0.73 | 0.46 | 0.83 |
| Financial Leverage | 1.84 | 1.77 | 1.78 |
While the ratios indicate good control over leverage, the high debt-to-equity ratio suggests a need for caution and focus on reducing financial obligations.
🤑 Fundamental Strength & Profitability
Profitability metrics are indicators of operational efficiency and financial health. Regency's moderate returns and healthy margins attest to its sustainable profit model, though continued monitoring is advised.
| Metric | 2024 | 2023 | 2022 |
|---|---|---|---|
| Return on Equity | 5.95% | 5.18% | 5.61% |
| Return on Assets | 3.23% | 2.93% | 3.15% |
| Net Margin | 27.54% | 27.57% | 27.93% |
| EBIT Margin | 41.19% | 35.72% | 51.86% |
| EBITDA Margin | 68.34% | 59.02% | 77.97% |
| Gross Margin | 43.07% | 70.15% | 71.74% |
The stable profitability ratios confirm the company’s capacity to generate earnings efficiently. A primary focus should be on expanding profit margins for sustained shareholder returns.
📈 Price Development
🔍 Dividend Scoring System
| Category | Score | Indicator |
|---|---|---|
| Dividend yield | 4 | |
| Dividend Stability | 5 | |
| Dividend growth | 3 | |
| Payout ratio | 2 | |
| Financial stability | 3 | |
| Dividend continuity | 5 | |
| Cashflow Coverage | 4 | |
| Balance Sheet Quality | 3 |
Total Score: 29/40
⭐ Rating
Regency Centers Corporation shows a commendable commitment to its dividend policy, featuring stable payouts and a consistent increase over decades. Despite challenges with high payout ratios, the financial structure and balance sheet quality suggest ongoing capability to support dividend yields. Investors should assess the potential risks associated with high debt levels against the steady cash flow and historical stability of dividends. Consider Regency Centers for a reliable income-producing addition to a balanced portfolio.
Smart Data Insight
Master the Perfect Entry & Exit for this Stock
Don't leave your profits to chance. Historically, this stock follows specific seasonal patterns that institutional traders use to maximize returns.
- ✅ Identify the "Golden Buying Window"
- ✅ Avoid high-risk correction cycles
- ✅ Backtested data from the last 20+ years