July 02, 2026 a 04:44 pm

REGN: Fibonacci Analysis - Regeneron Pharmaceuticals, Inc.
Regeneron Pharmaceuticals, Inc. (REGN) has shown a significant trend reversal in recent months. After reaching its highest point earlier, the stock experienced a downward trend, indicating investor caution. As a leading biopharmaceutical company, Regeneron's fundamental strength remains strong; however, market sentiments have caused fluctuations. Investors should consider both technical indicators and company developments when evaluating future performance.
Fibonacci Analysis
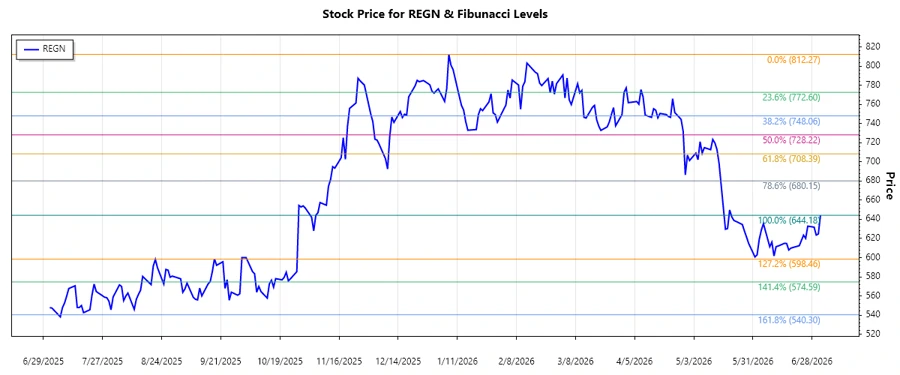
The most recent trend identified is a dominant downtrend. By examining price action from the highest point at $812.27 on 2026-01-07 to the lowest point at $644.18 on 2026-07-02, we calculated the following Fibonacci retracement levels:
| Level | Price |
|---|---|
| 0.236 | $680.76 |
| 0.382 | $701.05 |
| 0.5 | $728.23 |
| 0.618 | $755.41 |
| 0.786 | $788.89 |
Currently, the stock is trading near the 0.236 retracement level, which may act as a minor resistance point. If the price breaks above this level, it could signal a reversal or temporary upward correction. However, failure to breach this level may lead to further downside pressure.
Conclusion
The analysis highlights potential support and resistance levels for REGN. While the current trend is downward, the stock's proximity to the 0.236 Fibonacci level suggests a possible correction. If REGN breaches higher resistance levels, it may signal renewed investor interest. However, if it fails to maintain above the lower Fibonacci levels, further decline might ensue. Analysts should monitor economic indicators and sector trends closely to gauge Regeneron's future performance.
Smart Data Insight
Master the Perfect Entry & Exit for this Stock
Don't leave your profits to chance. Historically, this stock follows specific seasonal patterns that institutional traders use to maximize returns.
- ✅ Identify the "Golden Buying Window"
- ✅ Avoid high-risk correction cycles
- ✅ Backtested data from the last 20+ years