October 22, 2025 a 05:15 am
REGN: Fibonacci Analysis - Regeneron Pharmaceuticals, Inc.
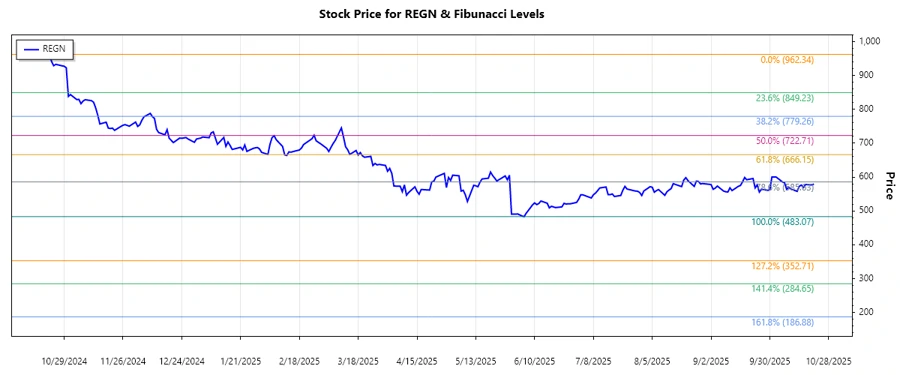
Regeneron Pharmaceuticals, Inc. has been experiencing a decline in its stock prices over recent months. The company has a diverse range of pharmaceutical products and partnerships with major firms worldwide. However, the recent market data suggests a dominant downward trend in the stock’s value. Technical analysts may consider potential bounce-back opportunities if prices approach key retracement levels.
Fibonacci Analysis
| Information | Details |
|---|---|
| Start Date | 2024-10-22 |
| End Date | 2025-10-21 |
| High Point | $962.34 on 2024-10-22 |
| Low Point | $483.07 on 2025-06-05 |
| Fibonacci Level | Price Level |
|---|---|
| 0.236 | $617.95 |
| 0.382 | $696.63 |
| 0.5 | $722.705 |
| 0.618 | $748.78 |
| 0.786 | $786.79 |
The current price of $579.34 is slightly above the 0.236 Fibonacci retracement level, suggesting a potential support zone. Continued monitoring for a reversal or continuation pattern is essential for evaluating potential investment decisions.
The stock currently appears to be finding support near the 0.236 level, often considered an initial bounce-back point in technical analysis. If the price fails to hold at this level, further declines toward the 0.382 level might be anticipated. Conversely, a strong push above this level can signal a potential trend reversal.
Conclusion
Regeneron's recent stock performance highlights a significant downtrend, bringing the stock to a key Fibonacci retracement level. This technical context suggests potential areas of support that investors might consider for possible entry points. Despite the downtrend, Regeneron’s robust pharmaceutical portfolio and industry partnerships offer avenues for future growth. However, economic conditions and sector trends should be closely monitored. Diversification in drug development and strategic collaborations may bolster long-term prospects. Risk management remains crucial, given current market volatility and the broader economic climate.
Smart Data Insight
Master the Perfect Entry & Exit for this Stock
Don't leave your profits to chance. Historically, this stock follows specific seasonal patterns that institutional traders use to maximize returns.
- ✅ Identify the "Golden Buying Window"
- ✅ Avoid high-risk correction cycles
- ✅ Backtested data from the last 20+ years