January 14, 2026 a 08:15 am

RCL: Trend and Support & Resistance Analysis - Royal Caribbean Cruises Ltd.
Royal Caribbean Cruises Ltd., headquartered in Miami, Florida, operates as a global cruise company with a versatile portfolio, offering various itineraries under well-known cruise brands. With strong brand recognition and expanding operations, RCL appears to have a robust standing in the market. However, the fluctuating trends and economic conditions pose risks that require continuous monitoring. The following analysis provides insights into the current trend, support, and resistance levels of RCL's stock, helping investors make informed decisions.
Trend Analysis
| Date | Closing Price | Trend |
|---|---|---|
| 2026-01-13 | $291.72 | ▼ |
| 2026-01-12 | $301.13 | ▲ |
| 2026-01-09 | $311.50 | ▲ |
| 2026-01-08 | $304.33 | ▼ |
| 2026-01-07 | $302.42 | ▼ |
| 2026-01-06 | $297.75 | ▼ |
| 2026-01-05 | $280.16 | ▼ |
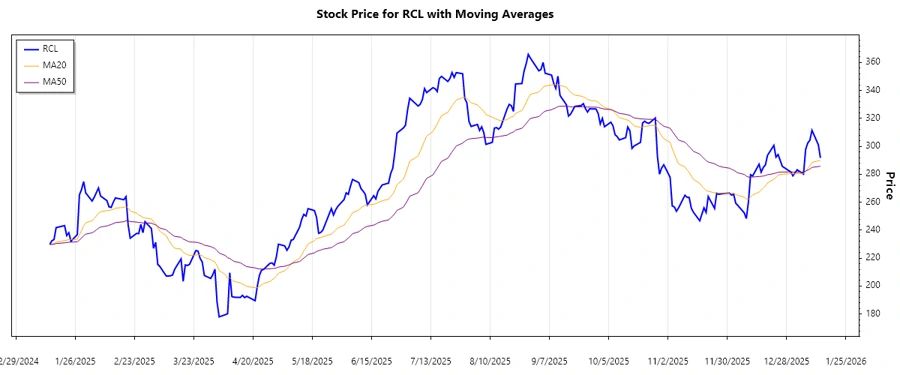
The recent trend analysis suggests a minor bearish movement as indicated by recent lower highs and lower lows. The EMA20 currently lies below the EMA50, indicating a downward trend. This suggests cautious observation, as the stock might be retracing or entering a consolidation phase.
Support and Resistance
| Zone Type | Zone Range |
|---|---|
| Support 1 | $260 - $268 |
| Support 2 | $245 - $255 |
| Resistance 1 | $310 - $320 |
| Resistance 2 | $330 - $340 |
The stock is presently trading between the first support and resistance zones, nearing a critical threshold that could dictate its upcoming direction. An approach beyond these limits may signal potential breakouts or further retracements, hinging on market dynamics.
Conclusion
Royal Caribbean Cruises Ltd. exhibits a changeable trend, compatible with typical market volatilities. While favorable demand and strategic growth broaden opportunities, potential geopolitical pressures and economic uncertainties represent tangible challenges. Navigating these dynamics prudently is crucial. Investors should monitor developments around the support and resistance levels for potential entry or exit points. Due diligence and agile market reactions remain pivotal for maximizing potential returns.