
July 02, 2026 a 03:15 pm
RCL: Fibonacci Analysis - Royal Caribbean Cruises Ltd.
Royal Caribbean Cruises Ltd. has shown an impressive recovery, rallying from significant lows. The technical analysis indicates an emerging pattern that investors should observe carefully. Despite global economic uncertainties, the demand in the cruise industry resurgence is noteworthy. However, market volatility due to geopolitical factors and economic slowdowns could pose potential risks. Overall, Royal Caribbean's strategic initiatives and fleet expansion provide a promising outlook for long-term growth.
Fibonacci Analysis
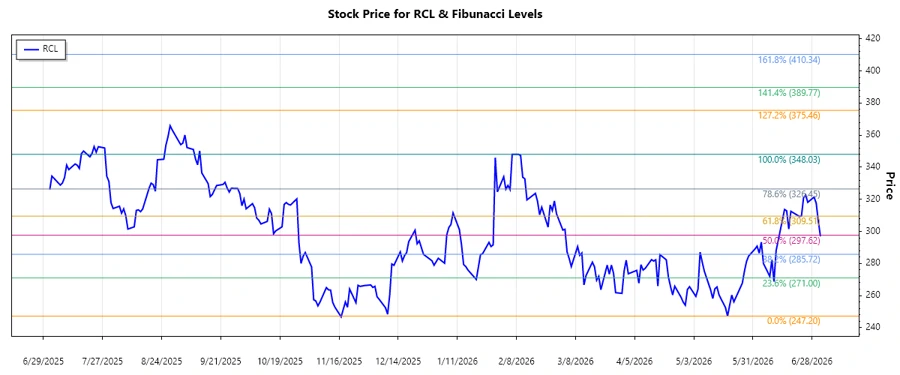
An analysis of Royal Caribbean's stock shows a recent upward trend, starting from a low of $247.20 on May 19, 2026, to a high of $348.03 on February 9, 2026. Utilizing Fibonacci retracement, we have identified potential levels of support and resistance.
| Timeframe | Price Level | Date |
|---|---|---|
| Low | $247.20 | 2026-05-19 |
| High | $348.03 | 2026-02-09 |
| 0.236 Retracement | $322.66 | |
| 0.382 Retracement | $310.04 | |
| 0.5 Retracement | $297.62 | |
| 0.618 Retracement | $285.20 | |
| 0.786 Retracement | $269.94 |
As of the last recorded date, the current price of $296.89 suggests that the stock is hovering near the 0.5 retracement level. This positioning indicates a potential support zone, offering a rebound opportunity or a failure to sustain could push prices lower.
Conclusion
Royal Caribbean's stock has experienced notable fluctuations, including substantial growth post-pandemic. The current positioning near the 0.5 Fibonacci retracement level highlights a critical support zone. Analysts may interpret this as an opportunity for buying on dips or a cautionary signal for further decline if support fails. The long-term trends and strategic company maneuvers make the stock appealing, yet vigilance is recommended as market sentiments can rapidly shift.
Smart Data Insight
Master the Perfect Entry & Exit for this Stock
Don't leave your profits to chance. Historically, this stock follows specific seasonal patterns that institutional traders use to maximize returns.
- ✅ Identify the "Golden Buying Window"
- ✅ Avoid high-risk correction cycles
- ✅ Backtested data from the last 20+ years