June 17, 2026 a 03:15 pm

RCL: Fibonacci Analysis - Royal Caribbean Cruises Ltd.
Royal Caribbean Cruises Ltd., one of the leaders in the global cruise industry, has experienced dynamic stock movements in recent months. While it benefits from a broad destination reach and strong brand portfolio, external factors such as geopolitical tensions and economic fluctuations could impact its stock price. As of the latest analysis, RCL's stock has been experiencing a notable downtrend, leading to potential strategic entry points for investors.
Fibonacci Analysis
Based on recent data, the RCL stock demonstrates a dominant downtrend. The analysis focuses on calculating Fibonacci retracement levels, providing key insights into potential support and resistance zones.
| Analysis Parameters | Details |
|---|---|
| Start Date | 2025-11-28 |
| End Date | 2026-06-17 |
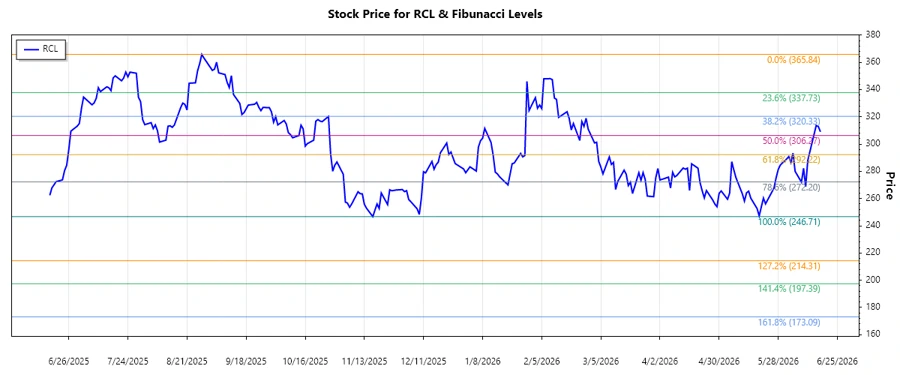
| High Price | $365.84 (2025-08-28) |
| Low Price | $246.71 (2025-11-17) |
| Fibonacci Level | Price Level |
|---|---|
| 0.236 | $274.99 |
| 0.382 | $290.70 |
| 0.5 | $306.28 |
| 0.618 | $321.87 |
| 0.786 | $343.00 |
The current price of $309 places it in the 0.5 retracement zone, suggesting potential support. Should this level hold, it may halt further declines and indicate a reversal.
Such a scenario typically hints at robust support and possible buyer interest at this level. Investors should be vigilant for signs of further consolidation or breakout beyond this zone.
Conclusion
The analysis suggests that RCL's stock is at a crucial juncture with possible support around its current price level. The defined Fibonacci zones offer significant insights for traders focusing on technical indicators to make informed decisions. However, external market conditions and intrinsic business challenges must remain on investors' radar when considering potential positions. If the stock price confirms support, a bullish reversal could present a buying opportunity; otherwise, further downside risks could emerge.
Smart Data Insight
Master the Perfect Entry & Exit for this Stock
Don't leave your profits to chance. Historically, this stock follows specific seasonal patterns that institutional traders use to maximize returns.
- ✅ Identify the "Golden Buying Window"
- ✅ Avoid high-risk correction cycles
- ✅ Backtested data from the last 20+ years