April 19, 2025 a 05:15 pm

RCL: Fibonacci Analysis - Royal Caribbean Cruises Ltd.
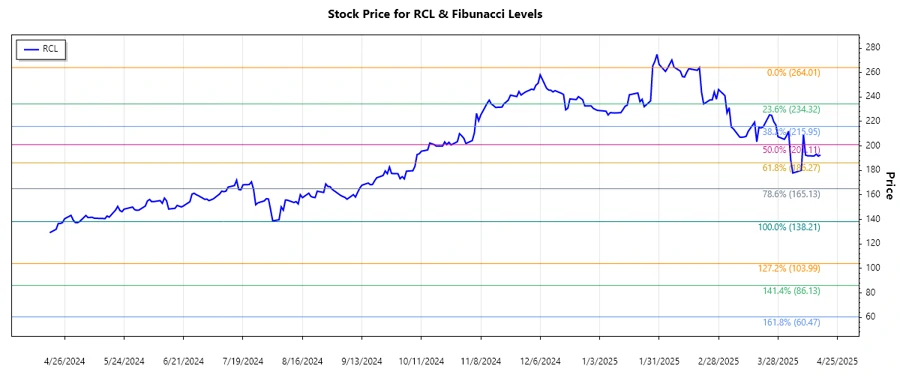
The Royal Caribbean Cruises Ltd. stock has seen a notable change in trend direction. Recent data indicate a downward trajectory as the company navigates through evolving market conditions and consumer demands. While the cruise industry shows signs of recovery, investors should consider potential market volatility, particularly given macroeconomic factors that might impact tourism and luxury travel.
Fibonacci Analysis
| Aspect | Details |
|---|---|
| Trend Start Date | 2024-11-21 |
| Trend End Date | 2025-04-17 |
| High Point | $264.01 (2025-02-19) |
| Low Point | $138.21 (2024-05-03) |
| Fibonacci Levels |
|
| Current Price | $192.69 |
| Retracement Zone | 0.236 |
| Technical Interpretation | The stock is testing the 0.236 retracement level, indicating potential resistance. Further movement above this level could signal a reversal, but failing to sustain above might suggest continued bearish pressure. |
Conclusion
The analysis of Royal Caribbean Cruises Ltd. demonstrates active engagement in a bearish trend, reflecting market corrections and adjustments. Despite a current position in the 0.236 Fibonacci retracement zone, upward momentum is needed to challenge and confirm potential bullish reversals. Risks remain high due to global economic uncertainties, potential changes in consumer behavior, and the sensitivity of the travel sector to external shocks. Analysts will need to keep an eye on demand recovery and corporate strategies to mitigate these risks while maintaining operational resilience. The findings imply a cautious approach, keeping technical and fundamental indicators under review.
Smart Data Insight
Master the Perfect Entry & Exit for this Stock
Don't leave your profits to chance. Historically, this stock follows specific seasonal patterns that institutional traders use to maximize returns.
- ✅ Identify the "Golden Buying Window"
- ✅ Avoid high-risk correction cycles
- ✅ Backtested data from the last 20+ years