
July 11, 2026 a 12:46 pm


RCL: Dividend Analysis - Royal Caribbean Cruises Ltd.
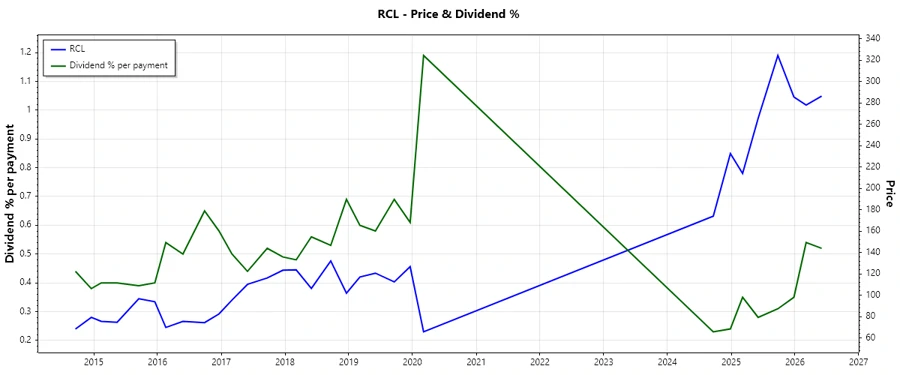
Royal Caribbean Cruises Ltd. presents an intriguing case for dividend investors with its long-standing history of dividend payments and a modest yield of 1.75%. Consideration should be given to its recent dividend trajectories and payout sustainability amidst market dynamics.
📊 Overview
Royal Caribbean Cruises Ltd. operates within the leisure industry sector, providing substantial opportunities for long-term dividends. It upholds a solid dividend history with 29 consistent years of payout. Presently, a dividend yield of 1.75% and a current dividend per share at 0.97 USD are noted. The latest suspension of dividends is remarkable by its absence, thus suggesting resilient dividend continuity.
| Metric | Value |
|---|---|
| Sector | Leisure Industry |
| Dividend yield | 1.75% |
| Current dividend per share | 0.97 USD |
| Dividend history | 29 years |
| Last cut or suspension | None |
🗣️ Dividend History
Royal Caribbean's illustrious 29-year dividend payment history is fundamental to understanding dividend reliability and shareholder satisfaction. This historical continuity is essential for attracting dividend-focused investors.
| Year | Dividend per Share (USD) |
|---|---|
| 2026 | 3.00 |
| 2025 | 3.50 |
| 2024 | 0.95 |
| 2020 | 0.78 |
| 2019 | 2.96 |
📈 Dividend Growth
Examining the growth rate of dividends across years provides insights into the company’s ability to enhance shareholder returns. The recent years show moderate growth, which suggests a careful yet steady dividend strategy.
| Time | Growth |
|---|---|
| 3 years | 0.65% |
| 5 years | 0.35% |
The average dividend growth is 0.35% over 5 years. This shows moderate but steady dividend growth, which may appeal to conservative investors prioritizing consistency over high growth.
📉 Payout Ratio
The payout ratio indicates the proportion of earnings distributed as dividends, vital for assessing dividend sustainability. Here, the EPS-based payout ratio stands at roughly 5.87%, combined with a free cash flow-based ratio of 19.06%, indicating significant retention for reinvestment or debt reduction.
| Key figure ratio | Value |
|---|---|
| EPS-based | 5.87% |
| Free cash flow-based | 19.06% |
The payout ratios reflect a conservative approach, beneficial for ensuring future stability and supporting potential business expansions or market recovery responses.
✅ Cashflow & Capital Efficiency
Effective cash flow management and capital deployment underscore a firm’s capacity to uphold dividend commitments alongside growth investments. The following metrics provide a snapshot of financial vitality and operational efficiency.
| Metric | 2025 | 2024 | 2023 |
|---|---|---|---|
| Free Cash Flow Yield | 1.64% | 3.32% | 1.75% |
| Earnings Yield | 5.65% | 4.78% | 5.12% |
| CAPEX to Operating Cash Flow | 79.45% | 62.07% | 87.04% |
| Stock-based Compensation to Revenue | 0.98% | 1.62% | 0.91% |
| Free Cash Flow / Operating Cash Flow Ratio | 19.12% | 37.93% | 12.95% |
Despite volatility in cash flow coverage ratios, the overall trajectory aligns with a premium cruise sector business navigating intricate market challenges with strategic resilience.
📊 Balance Sheet & Leverage Analysis
Scrutinizing leverage ratios reveals insights into balance sheet robustness and financial risk management practices. The current metrics reflect Royal Caribbean's leverage strategies in maintaining operational fluidity.
| Metric | 2025 | 2024 | 2023 |
|---|---|---|---|
| Debt-to-Equity | 225.52% | 275.29% | 468.46% |
| Debt-to-Assets | 54.39% | 56.16% | 62.99% |
| Debt-to-Capital | 69.28% | 73.35% | 82.41% |
| Net Debt to EBITDA | 3.16 | 3.36 | 4.74 |
| Current Ratio | 0.18 | 0.17 | 0.19 |
High leverage metrics indicate potential vulnerability, reliant significantly on consistent operational cash flow. While strategic, such leverage levels call for vigilant cash and liquidity controls.
📈 Fundamental Strength & Profitability
Fundamental strength metrics elucidate profitability trends and operational efficiencies, laying the foundation for long-term sustainability and competitive market positioning.
| Metric | 2025 | 2024 | 2023 |
|---|---|---|---|
| Return on Equity | 42.57% | 38.04% | 35.92% |
| Return on Assets | 10.27% | 7.76% | 4.83% |
| Margins: Net, EBIT, EBITDA, Gross | 23.82%, 29.53%, 38.52%, 46.84% | 17.45%, 27.22%, 36.92%, 47.52% | 12.21%, 22.35%, 32.81%, 44.06% |
| Research & Development to Revenue | 0% | 0% | 0% |
While research allocation is nil, margins and returns depict robust practices conducive to operational success amidst competition.
📊 Price Development
🗳️ Dividend Scoring System
| Criterion | Score | Score Bar |
|---|---|---|
| Dividend yield | 3 | |
| Dividend Stability | 4 | |
| Dividend growth | 2 | |
| Payout ratio | 4 | |
| Financial stability | 3 | |
| Dividend continuity | 5 | |
| Cashflow Coverage | 3 | |
| Balance Sheet Quality | 2 |
Total Score: 26 out of 40 points
📝 Rating
In summary, Royal Caribbean Cruises Ltd. showcases reliable dividend yield and continuity, offset by modest growth and complex leverage conditions. It is advised for investors valuing long-term stability and industry resilience over high returns.
Smart Data Insight
Master the Perfect Entry & Exit for this Stock
Don't leave your profits to chance. Historically, this stock follows specific seasonal patterns that institutional traders use to maximize returns.
- ✅ Identify the "Golden Buying Window"
- ✅ Avoid high-risk correction cycles
- ✅ Backtested data from the last 20+ years