
April 26, 2026 a 07:30 am

RCL: Dividend Analysis - Royal Caribbean Cruises Ltd.
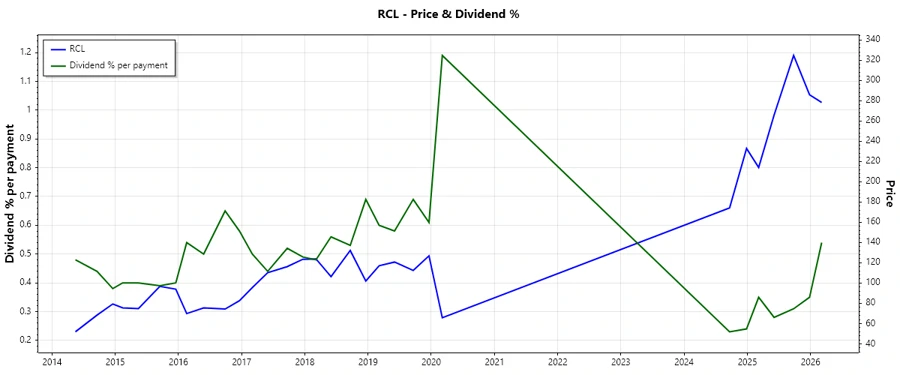
📊 Royal Caribbean Cruises Ltd. demonstrates a moderate dividend yield, supporting its appeal to income-focused investors. With a stable dividend history spanning 29 years, RCL highlights financial resilience. While recent dividend growth has been modest, the company's ability to sustain payouts during market fluctuations can be appealing for conservative dividend seekers. Its payout ratios, both EPS and FCF-based, suggest a conservative distribution strategy, prioritizing long-term sustainability in shareholder returns.
Overview
🗣️ Analyzing the comprehensive financial framework of Royal Caribbean Cruises Ltd. reveals insights into its dividend mechanics and sector position. As a key player in the Consumer Discretionary sector, RCL maintains a dividend yield of 1.53%, with current dividend offerings at 0.97 USD per share. Over 29 years of consistent dividend history, it reinforces investor confidence with no recent cuts or suspensions.
| Criteria | Details |
|---|---|
| Sector | Consumer Discretionary |
| Dividend Yield | 1.53% |
| Current Dividend per Share | 0.97 USD |
| Dividend History | 29 years |
| Last Cut or Suspension | None |
Dividend History
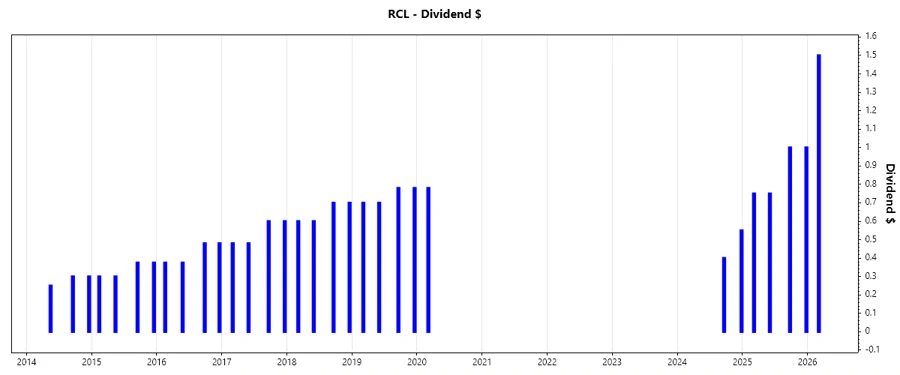
📈 A thorough evaluation of RCL’s dividend trajectory shows its commitment to shareholders over the years. The absence of recent cuts further testifies to the company's fiscal discipline. A focus on sustainable dividends amidst market trends emphasizes its operational robustness.
| Year | Dividend per Share (USD) |
|---|---|
| 2026 | 1.50 |
| 2025 | 3.50 |
| 2024 | 0.95 |
| 2020 | 0.78 |
| 2019 | 2.96 |
Dividend Growth
📊 Examining dividend growth rates provides insight into RCL’s flexibility in enhancing shareholder returns. Analyzing growth over different periods aids investors in assessing stability and future prospects for income growth.
| Time | Growth |
|---|---|
| 3 years | 0.65% |
| 5 years | 0.35% |
✅ The average dividend growth is 0.35% over 5 years. This shows moderate but steady dividend growth, indicative of enduring business strength.
Payout Ratio
⚠️ Critical to dividend evaluation is the payout ratio, dictating RCL’s capacity to sustain dividends relative to earnings and cash flow metrics. Insight into these ratios elucidates prudent financial stewardship.
| Key Figure | Ratio |
|---|---|
| EPS-based | 6.18% |
| Free Cash Flow-based | 21.32% |
✅ RCL's payout ratios are conservative, with a 6.18% EPS ratio and a 21.32% FCF ratio, indicating robust capacity to maintain dividend payments without excessive income portioning.
Cashflow & Capital Efficiency
📊 Cash flow and capital return efficiency form the core of sustainable operations. RCL’s metrics provide a window into its capability to uphold operational throughput and shareholder yield over time.
| Metrics | 2023 | 2024 | 2025 |
|---|---|---|---|
| Free Cash Flow Yield | 1.75% | 3.31% | 1.64% |
| Earnings Yield | 5.12% | 4.78% | 5.65% |
| CAPEX to Operating Cash Flow | 87.04% | 62.07% | 80.88% |
| Stock-based Compensation to Revenue | 0.91% | 1.62% | N/A |
| Free Cash Flow / Operating Cash Flow Ratio | 12.96% | 37.93% | 19.12% |
| Return on Invested Capital | 10.46% | 14.19% | 14.90% |
✅ The metrics suggest that RCL maintains healthy capital and operating efficiencies, showcasing strategic asset deployment to optimize returns.
Balance Sheet & Leverage Analysis
🗣️ A robust balance sheet with manageable leverage ratios is paramount to ensuring financial stability and liquidity, safeguarding against market downturns.
| Metrics | 2023 | 2024 | 2025 |
|---|---|---|---|
| Debt-to-Equity | 468% | 275% | 225% |
| Debt-to-Assets | 63% | 56% | 54% |
| Debt-to-Capital | 82% | 73% | 69% |
| Net Debt to EBITDA | 474% | 336% | 316% |
| Current Ratio | 0.19 | 0.17 | 0.18 |
| Quick Ratio | 0.16 | 0.15 | 0.16 |
| Financial Leverage | 744% | 491% | 414% |
⚠️ The leverage ratios indicate RCL’s significant reliance on debt financing, highlighting the importance of maintaining efficient cash flow management to address debt obligations and liquidity maintenance.
Fundamental Strength & Profitability
📈 Profitability is indicative of business health. Consistent returns on equity and assets support sustained shareholder value enhancement.
| Metrics | 2023 | 2024 | 2025 |
|---|---|---|---|
| Return on Equity | 35.92% | 38.04% | 42.57% |
| Return on Assets | 4.83% | 7.76% | 10.27% |
| Margins: Net | 12.21% | 17.45% | 23.82% |
| Margins: EBIT | 22.35% | 27.22% | 29.53% |
| Margins: EBITDA | 32.81% | 36.92% | 38.52% |
| Margins: Gross | 44.06% | 47.52% | 46.84% |
| Research & Development to Revenue | 0% | 0% | 0% |
✅ The firm demonstrates a solid profitability profile, with impressive returns on both equity and assets, supporting assertive income stream generation without substantial R&D investment burdens.
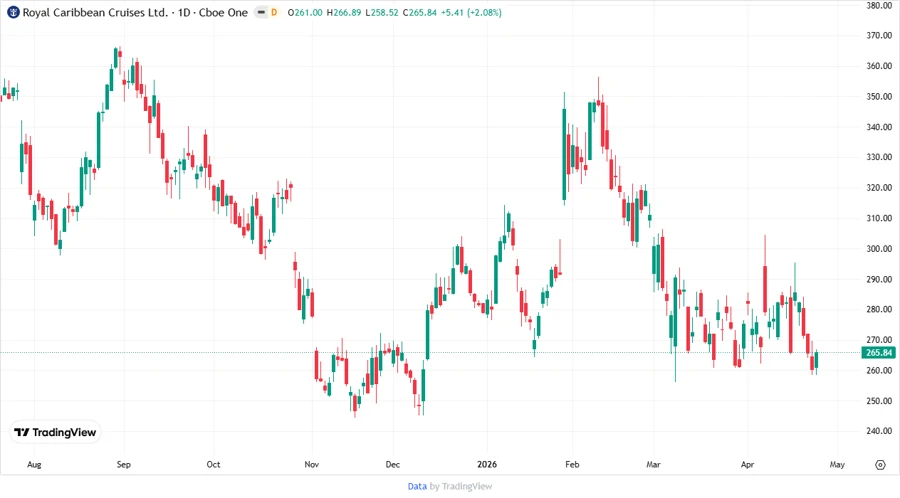
Price Development
Dividend Scoring System
📊 Here's how Royal Caribbean Cruises Ltd. scores on different dividend assessment criteria, offering a composite view of its dividend strength.
| Criteria | Score | Score Bar |
|---|---|---|
| Dividend Yield | 3 | |
| Dividend Stability | 4 | |
| Dividend Growth | 2 | |
| Payout Ratio | 5 | |
| Financial Stability | 3 | |
| Dividend Continuity | 4 | |
| Cashflow Coverage | 3 | |
| Balance Sheet Quality | 2 |
Total Score: 26/40
Rating
🗣️ In conclusion, Royal Caribbean Cruises Ltd. offers a stable yet modest dividend yield with a strong history of continuity and conservative payout strategy. While its growth metrics are modest, the fiscal discipline is noteworthy. Potential investors may find its financial prudence and reliable income stream appealing, though a closer examination of its leverage ratios is advised for full risk assessment.
Smart Data Insight
Master the Perfect Entry & Exit for this Stock
Don't leave your profits to chance. Historically, this stock follows specific seasonal patterns that institutional traders use to maximize returns.
- ✅ Identify the "Golden Buying Window"
- ✅ Avoid high-risk correction cycles
- ✅ Backtested data from the last 20+ years