February 13, 2026 a 03:31 am

RCL: Dividend Analysis - Royal Caribbean Cruises Ltd.
Royal Caribbean Cruises Ltd. (RCL) presents a captivating opportunity in the cruise industry with its strategic, yet variable dividend approach. With steady growth in dividends over historical periods, coupled with a current yield that reflects cautious payout strategies, the company's dividends are compelling for long-term investors. However, potential risks such as economic downturns affecting cruise demand and last known dividend suspension in 2020 should be considered while forecasting future performances. A strong focus on shareholder value coupled with operational resilience denotes a promising trajectory for the investing horizon.
📊 Overview
Royal Caribbean Cruises operates in the consumer discretionary sector, delivering leisure experiences through its extensive fleet of cruise ships. Its dividend profile is characterized by a dividend yield of 1.23%, reflecting a prudent approach to shareholder payouts, with a current dividend per share of 0.97 USD. With a rich history of 28 years of dividend distributions, the last cut was observed in 2020, underlining the company's commitment to resuming sustainable payouts post-pandemic disruptions.
| Metric | Detail |
|---|---|
| Sector: | Consumer Discretionary |
| Dividend Yield: | 1.23% |
| Current Dividend per Share: | $0.97 |
| Dividend History: | 28 years |
| Last Cut or Suspension: | 2020 |
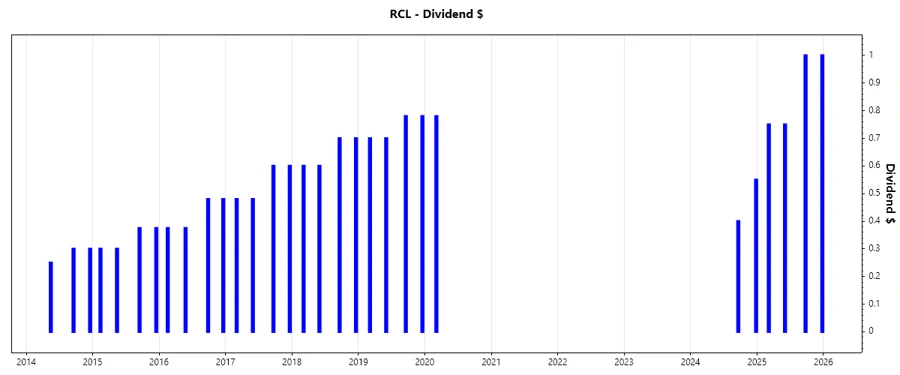
🗣️ Dividend History
The dividend history of Royal Caribbean Cruises is a testament to its resilience and commitment to shareholders. With fluctuations that mirror the company's operational strategy and economic cycles, the dividend history offers insights into periods of robust performance and strategic realignments.
| Year | Dividend per Share (USD) |
|---|---|
| 2025 | $3.50 |
| 2024 | $0.95 |
| 2020 | $0.78 |
| 2019 | $2.96 |
| 2018 | $2.60 |
📈 Dividend Growth
Evaluating the growth in dividends over time reveals significant insights into the company’s operational health and shareholder return strategies. The company's average dividend growth of 0.35% over the past 5 years indicates a moderate but steady growth trajectory, suggesting careful financial stewardship amidst variable market conditions.
| Time Frame | Growth |
|---|---|
| 3 Years | 0.65% |
| 5 Years | 0.35% |
The average dividend growth is 0.35% over 5 years. This shows moderate but steady dividend growth.
⚠️ Payout Ratio
Payout ratios are critical indicators of dividend sustainability, revealing how much of the income is returned to shareholders versus reinvested for growth. The EPS-based payout ratio stands at 6.18%, while the free cash flow-based ratio is 21.49%. These figures suggest that a cautious portion of earnings is being utilized for dividends, supporting growth-oriented reinvestment strategies.
| Key Figure | Ratio |
|---|---|
| EPS-based | 6.18% |
| Free cash flow-based | 21.49% |
The low EPS and moderate FCF payout ratios highlight a strategic balance between rewarding shareholders and retaining capital for reinvestment, ensuring a sustainable dividend policy.
✅ Cashflow & Capital Efficiency
Cash flow figures provide a lens into the operational efficiency and potential liquidity constraints faced by Royal Caribbean Cruises. The free cash flow yield of 1.36% suggests modest liquidity under current market operations. Positive earnings yield and efficient capital allocation ratios point to a thoroughly balanced capital deployment strategy.
| Year | 2023 | 2024 | 2025 |
|---|---|---|---|
| Free Cash Flow Yield | 1.75% | 3.32% | 1.64% |
| Earnings Yield | 5.12% | 4.78% | 5.65% |
| CAPEX to Operating Cash Flow | 87.04% | 62.07% | 80.88% |
| Stock-based Compensation to Revenue | 0.91% | 1.62% | 0.98% |
| Free Cash Flow / Operating Cash Flow Ratio | 12.96% | 37.93% | 19.11% |
The company's cash flow sustainability and capital efficiency remain measured, necessitating continued scrutiny to ensure capital returns align with strategic targets.
📉 Balance Sheet & Leverage Analysis
The balance sheet robustness is critical to understanding the company's leverage strategy and financial health. A high debt-to-equity ratio of 2.25 reflects significant leverage, balanced by a manageable net debt to EBITDA ratio, indicating potential pressure points in liquidity management.
| Year | 2023 | 2024 | 2025 |
|---|---|---|---|
| Debt-to-Equity | 4.68 | 2.75 | 2.25 |
| Debt-to-Assets | 62.99% | 56.16% | 54.39% |
| Debt-to-Capital | 82.41% | 73.35% | 69.28% |
| Net Debt to EBITDA | 4.74 | 3.36 | 3.16 |
| Current Ratio | 0.19 | 0.17 | 0.18 |
| Quick Ratio | 0.16 | 0.15 | 0.16 |
| Financial Leverage | 7.44 | 4.90 | 4.15 |
The analysis highlights substantial leverage but a reducing trend, aligning with the company's strategic deleveraging initiatives to enhance liquidity.
🗣️ Fundamental Strength & Profitability
Profitability and fundamental strength reveal the company's vitality in generating returns relative to equity and assets. Royal Caribbean exhibits a respectable return on equity value, aiding in sustaining competitive advantage.
| Year | 2023 | 2024 | 2025 |
|---|---|---|---|
| Return on Equity | 35.92% | 38.04% | 42.57% |
| Return on Assets | 4.83% | 7.76% | 10.27% |
| Net Margin | 12.21% | 17.45% | 23.82% |
| EBIT Margin | 22.35% | 27.22% | 29.53% |
| EBITDA Margin | 32.81% | 36.92% | 38.52% |
| Gross Margin | 44.06% | 47.52% | 46.84% |
| Research & Development to Revenue | 0% | 0% | 0% |
The robust returns on key profitability ratios confirm strategic efficiencies and bolster its ability to reinvest for sustainable growth.
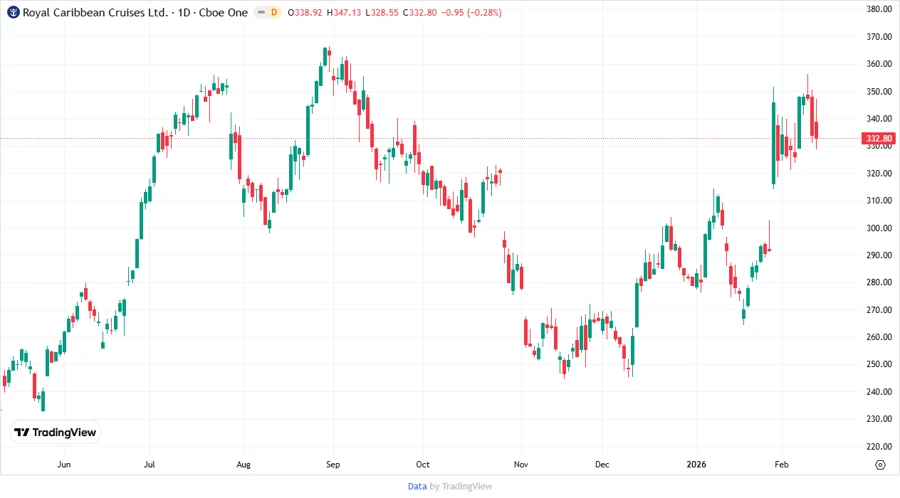
📈 Price Development
🎯 Dividend Scoring System
This scoring system evaluates the overall robustness and sustainability of the company's dividend offering.
| Category | Points | Score Bar |
|---|---|---|
| Dividend Yield | 3 | |
| Dividend Stability | 4 | |
| Dividend Growth | 3 | |
| Payout Ratio | 3 | |
| Financial Stability | 3 | |
| Dividend Continuity | 4 | |
| Cashflow Coverage | 3 | |
| Balance Sheet Quality | 3 |
Total Score: 26/40
🏆 Rating
Overall, Royal Caribbean Cruises Ltd. exhibits an above-average dividend profile characterized by steady growth and strategic conservatism. This profile is well-suited to investors seeking moderate but reliable returns amidst a dynamic operational landscape. While its leverage strategy presents certain risks, the company’s comprehensive approach to retaining and distributing earnings suggests potential for sustainable continued performance.