November 27, 2025 a 02:46 am

RCL: Dividend Analysis - Royal Caribbean Cruises Ltd.
Royal Caribbean Cruises Ltd. (RCL) offers a modest dividend yield but presents a stable, longstanding dividend history. Although recent years have shown fluctuations, the company continues to maintain a resilient payout structure, reflecting its enduring presence in the cruise industry. However, the high payout ratios indicate potential financial pressures that might affect future distributions.
📊 Overview
Royal Caribbean Cruises Ltd. operates within the Consumer Discretionary sector with a significant record of dividend consistency and resilience against economic cycles.
| Key Metrics | Value |
|---|---|
| Sector | Consumer Discretionary |
| Dividend yield | 0.94 % |
| Current dividend per share | 0.41 USD |
| Dividend history | 28 years |
| Last cut or suspension | 2020 |
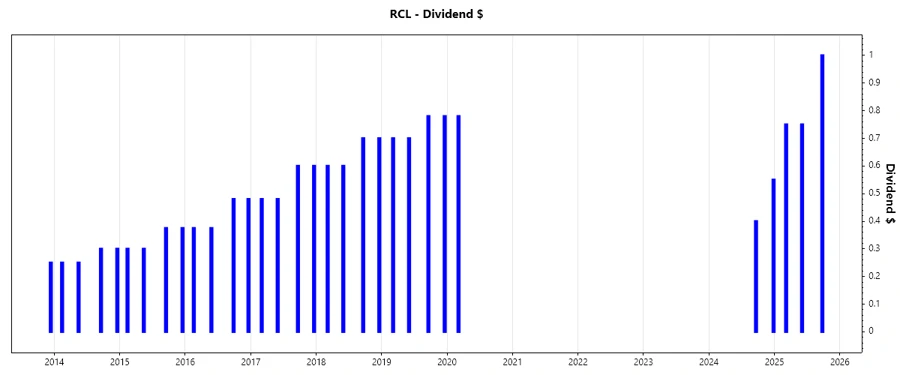
🗣️ Dividend History
Royal Caribbean has demonstrated a strong historical commitment to its dividend payments over the past 28 years, an essential indicator of its financial health and shareholder return strategy. This longevity provides confidence but requires monitoring amid industry volatility.
| Year | Dividend per Share (USD) |
|---|---|
| 2025 | 2.50 |
| 2024 | 0.95 |
| 2020 | 0.78 |
| 2019 | 2.96 |
| 2018 | 2.60 |
📈 Dividend Growth
The growth trajectory of the dividends for Royal Caribbean over 3 and 5 years presents a mixed outlook. The recent uplift aims to recover from past suspensions.
| Time | Growth |
|---|---|
| 3 years | 6.79 % |
| 5 years | -20.33 % |
The average dividend growth is -20.33 % over 5 years. This shows moderate but steady dividend growth, though recent performance suggests a need for caution.
📉 Payout Ratio
Payout ratios give insight into the sustainability of dividend payments, aligning financial health with income distribution strategies.
| Key figure | Ratio |
|---|---|
| EPS-based | 273.91 % |
| Free cash flow-based | 549.39 % |
The EPS-based payout ratio of 273.91 % and the FCF-based payout ratio of 549.39 % indicate that the dividends are not fully covered by earnings or cash flow, suggesting potential stress on sustaining payouts.
✅ Cashflow & Capital Efficiency
An analysis of cashflow and capital efficiency ratios is crucial to understand operational liquidity and returns from capital investment.
| Metric | 2024 | 2023 | 2022 |
|---|---|---|---|
| Free Cash Flow Yield | 3.32% | 1.75% | -17.68% |
| Earnings Yield | 4.78% | 5.12% | -17.10% |
| CAPEX to Operating Cash Flow | 62.07% | 87.04% | 563.41% |
| Stock-based Compensation to Revenue | 1.62% | 0.91% | 0.41% |
| Free Cash Flow / Operating Cash Flow Ratio | 37.93% | 12.96% | -463.41% |
These metrics suggest challenges in capital efficiency, with high ratios suggesting substantial reinvestment and cost competitiveness needs.
📈 Balance Sheet & Leverage Analysis
A robust balance sheet and leverage analysis provide insights into financial resilience and risk management capabilities.
| Metric | 2024 | 2023 | 2022 |
|---|---|---|---|
| Debt-to-Equity | 275.29% | 468.46% | 836.32% |
| Debt-to-Assets | 56.16% | 62.99% | 71.04% |
| Debt-to-Capital | 73.35% | 82.41% | 89.32% |
| Net Debt to EBITDA | 3.36 | 4.74 | 35.87 |
| Current Ratio | 0.17 | 0.19 | 0.37 |
| Quick Ratio | 0.15 | 0.16 | 0.35 |
| Financial Leverage | 4.90 | 7.44 | 11.77 |
The significant leverage indicates heightened risk, necessitating careful monitoring to maintain financial solvency and market position.
📊 Fundamental Strength & Profitability
Understanding core profitability metrics highlights operational efficiency and shareholder returns, essential for long-term viability.
| Metric | 2024 | 2023 | 2022 |
|---|---|---|---|
| Return on Equity | 38.04% | 35.92% | -75.15% |
| Return on Assets | 7.76% | 4.83% | -6.38% |
| Net Margin | 17.45% | 12.21% | -24.39% |
| EBIT Margin | 27.22% | 22.35% | -8.96% |
| EBITDA Margin | 36.92% | 32.81% | 6.96% |
| Gross Margin | 47.52% | 44.06% | 25.16% |
| R&D to Revenue | 0% | 0% | 0% |
Profitability margins reflect volatility but improving trends. Strategic focus on better cost management could enhance future profitability.
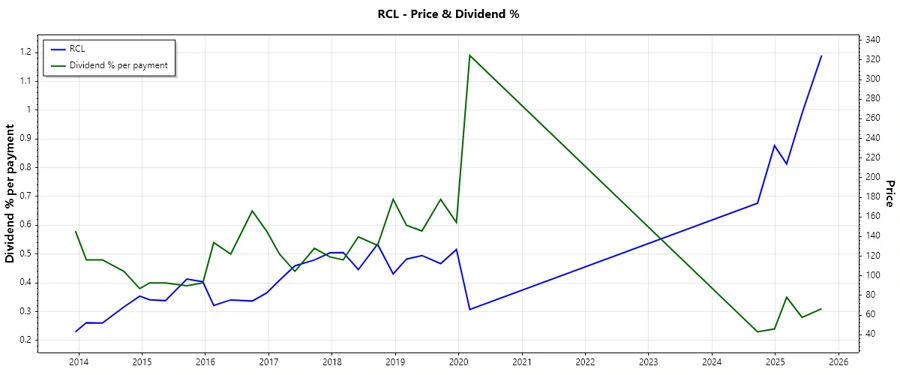
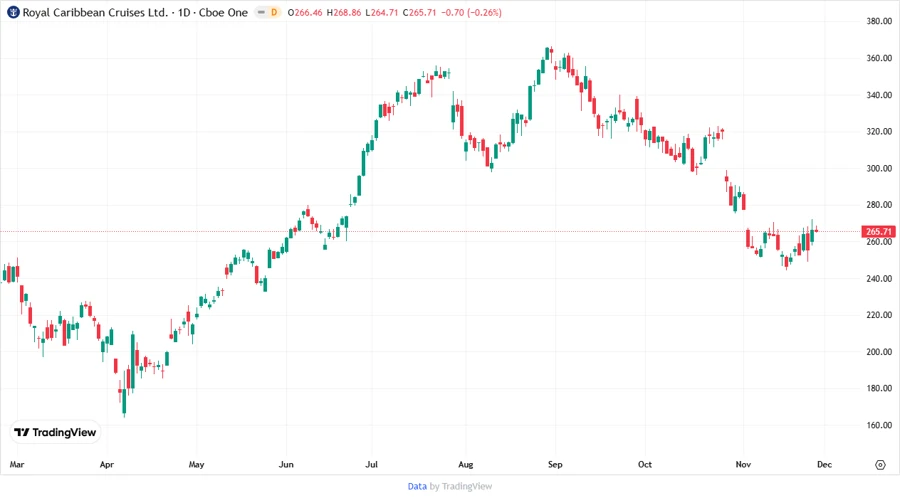
📈 Price Development
🗣️ Dividend Scoring System
| Category | Description | Score |
|---|---|---|
| Dividend yield | Currently modest return from investment | 2/5 |
| Dividend Stability | Strong history but recent cuts | 3/5 |
| Dividend growth | Recovery phase with past declines | 2/5 |
| Payout ratio | High ratios indicate potential stress | 2/5 |
| Financial stability | Challenging leverage positions | 2/5 |
| Dividend continuity | Historically consistent with recent cuts | 3/5 |
| Cashflow Coverage | Shows liquidity challenges | 2/5 |
| Balance Sheet Quality | Substantial debt levels | 2/5 |
Total Score: 18/40
Rating
Based on the analysis, Royal Caribbean Cruises Ltd. faces multiple financial pressures which impact its capacity to maintain and grow its dividends reliably. While it holds a well-established market position, strategic improvements in cash flow efficiency, cost management, and leverage reduction could enhance its dividend attractiveness. Potential investors should weigh current dividend challenges against long-term recovery potential. This stock is rated as a "Hold" for risk-tolerant dividend investors.