September 24, 2025 a 12:47 pm

RCL: Dividend Analysis - Royal Caribbean Cruises Ltd.
Royal Caribbean Cruises Ltd. offers a notable dividend profile with a consistent history. Despite recent disruptions, the company shows commitment to its dividend policy. This analysis provides insights into the sustainability and growth potential of its dividends for investors seeking income.
📊 Overview
Royal Caribbean Cruises Ltd. operates in the Consumer Discretionary sector, providing passenger cruise services. Below is a summary of its current dividend metrics:
| Metric | Value |
|---|---|
| Sector | Consumer Discretionary |
| Dividend yield | 0.92% |
| Current dividend per share | 0.41 USD |
| Dividend history | 28 years |
| Last cut or suspension | 2020 |
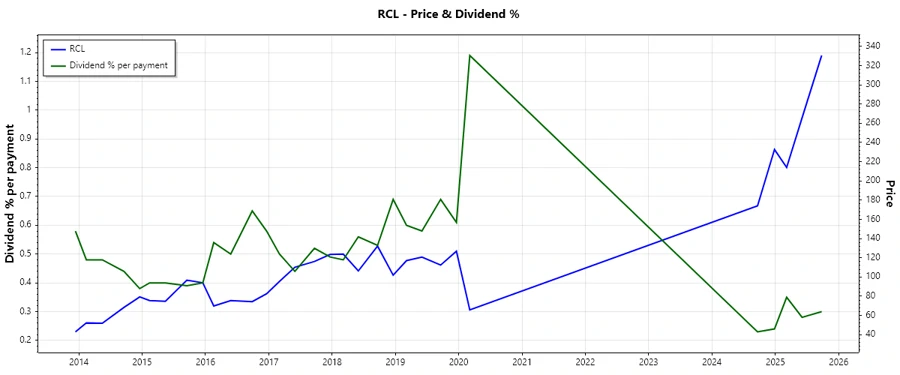
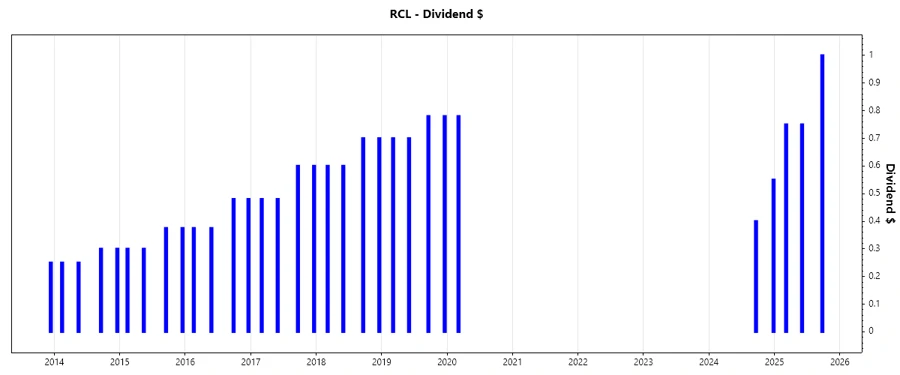
🗣️ Dividend History
Understanding the historical pattern of dividend payments is essential for assessing the reliability and policy stability of the company. Below is an image showing historical dividend changes:
| Year | Dividend per Share (USD) |
|---|---|
| 2025 | 2.50 |
| 2024 | 0.95 |
| 2020 | 0.78 |
| 2019 | 2.96 |
| 2018 | 2.60 |
📈 Dividend Growth
The dividend growth rate is a critical indicator of a company’s ability to consistently increase dividends over time. A comparison of growth over different periods is provided:
| Time | Growth |
|---|---|
| 3 years | 6.79% |
| 5 years | -20.33% |
The average dividend growth is -20.33% over 5 years. This shows a recent concerning trend in dividend cuts.
🧮 Payout Ratio
The payout ratio illustrates the proportion of earnings a company pays as dividends to shareholders, indicating sustainability and capacity for future growth.
| Key figure | Ratio |
|---|---|
| EPS-based | 3.09% |
| Free cash flow-based | 3.10% |
With EPS-based and FCF-based payout ratios below industry norms, this suggests a conservative dividend policy, potentially ensuring stability or growth from current levels.
💰 Cashflow & Capital Efficiency
Assessing cash flow and capital efficiency is crucial for understanding the economic robustness and operational health of the company.
| Metric | 2024 | 2023 | 2022 |
|---|---|---|---|
| Free Cash Flow Yield | 3.31% | 1.75% | -17.68% |
| Earnings Yield | 4.78% | 5.12% | -17.10% |
| CAPEX to Operating Cash Flow | 62.07% | 87.04% | 563.41% |
| Stock-based Compensation to Revenue | 1.62% | 0.91% | 0.41% |
| Free Cash Flow / Operating Cash Flow Ratio | 37.93% | 12.96% | -463.41% |
The efficiency metrics show volatile cash flow performance, with recent trends indicating recovery yet highlighting the need for more sustainable operations.
📉 Balance Sheet & Leverage Analysis
Evaluating the balance sheet dynamics provides insights into financial stability, risk exposure, and the company’s ability to manage its debt.
| Metric | 2024 | 2023 | 2022 |
|---|---|---|---|
| Debt-to-Equity | 275.29% | 468.46% | 836.32% |
| Debt-to-Assets | 56.16% | 62.99% | 71.03% |
| Debt-to-Capital | 73.35% | 82.41% | 89.32% |
| Net Debt to EBITDA | 3.36 | 4.74 | 35.87 |
| Current Ratio | 0.17 | 0.19 | 0.37 |
| Quick Ratio | 0.15 | 0.16 | 0.35 |
| Financial Leverage | 490.15% | 743.67% | 1177.27% |
The balance sheet analysis reveals high leverage, suggesting potential financial vulnerabilities but also opportunities for leveraging assets during recovery periods.
💡 Fundamental Strength & Profitability
Core profitability and efficiency measurements are crucial for evaluating the enterprise’s ability to generate profits and shareholder returns.
| Metric | 2024 | 2023 | 2022 |
|---|---|---|---|
| Return on Equity | 38.04% | 35.92% | -75.15% |
| Return on Assets | 7.76% | 4.83% | -6.38% |
| Margins: Net | 17.45% | 12.21% | -24.39% |
| EBIT Margin | 27.22% | 22.35% | -8.96% |
| EBITDA Margin | 36.92% | 32.81% | 6.96% |
| Gross Margin | 47.52% | 44.06% | 25.16% |
| Research & Development to Revenue | 0% | 0% | 0% |
The profitability metrics have improved, yet the underlying operational challenges continue, reflecting recovery within an uncertain external environment.
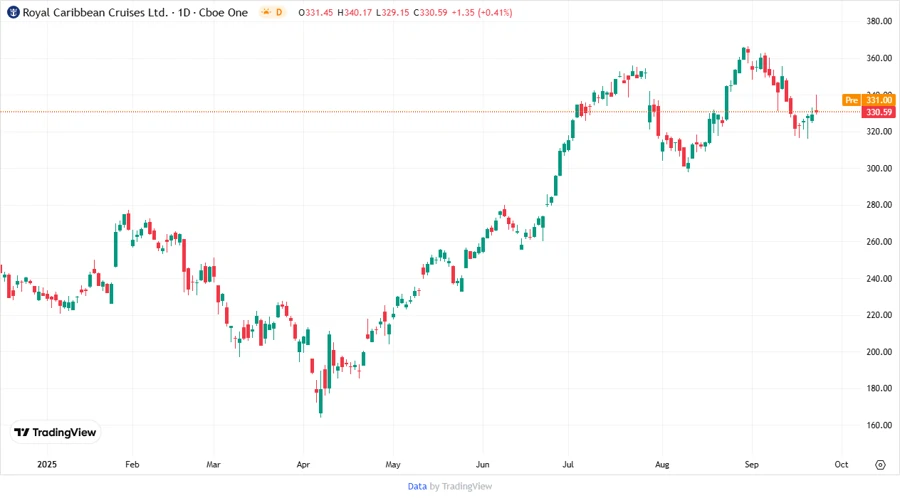
📊 Price Development
✅ Dividend Scoring System
An individualized dividend scoring system assesses varied aspects of the company's dividend policy and financial standing:
| Criteria | Score | |
|---|---|---|
| Dividend yield | 2 | |
| Dividend stability | 3 | |
| Dividend growth | 1 | |
| Payout ratio | 4 | |
| Financial stability | 2 | |
| Dividend continuity | 4 | |
| Cashflow Coverage | 2 | |
| Balance Sheet Quality | 2 |
Total Score: 20/40
🔥 Rating
Royal Caribbean Cruises Ltd. demonstrates resilience within a challenging market environment but also faces several structural and financial challenges. Investors should weigh the risks and potential returns carefully, considering both dividend prospects and broader financial metrics.
Smart Data Insight
Master the Perfect Entry & Exit for this Stock
Don't leave your profits to chance. Historically, this stock follows specific seasonal patterns that institutional traders use to maximize returns.
- ✅ Identify the "Golden Buying Window"
- ✅ Avoid high-risk correction cycles
- ✅ Backtested data from the last 20+ years