August 14, 2025 a 07:31 am

RCL: Dividend Analysis - Royal Caribbean Cruises Ltd.
Royal Caribbean Cruises Ltd., a leading company in the tourism and leisure sector, has demonstrated resilience in its dividend policy despite recent challenges. With a longstanding dividend history of 28 years, the company offers a modest dividend yield of 0.92%. However, the last few years have seen significant volatility in payout levels, particularly highlighted by a cut or suspension in 2020. As the cruise industry gradually recovers, investors remain cautious yet hopeful for sustained growth and dividend reinstatement.
📊 Overview
The following details provide an overview of Royal Caribbean's current dividend metrics, shedding light on its potential allure and risks in the current market environment.
| Metric | Value |
|---|---|
| Sector | Tourism and Leisure |
| Dividend Yield | 0.92 % |
| Current Dividend Per Share | 0.41 USD |
| Dividend History | 28 years |
| Last Cut or Suspension | 2020 |
🗣️ Dividend History
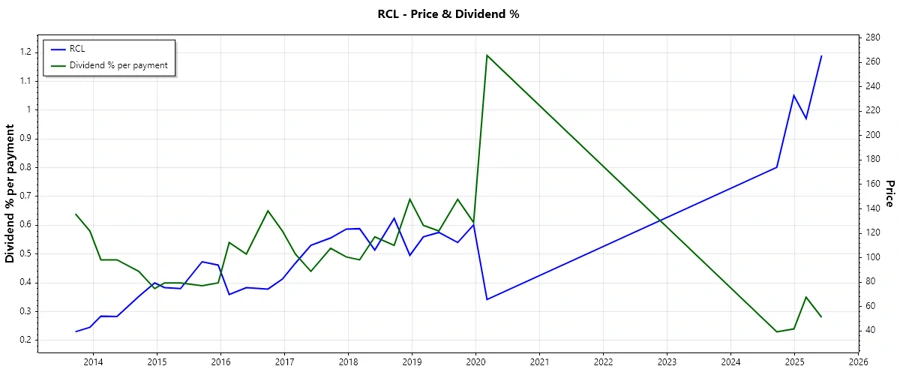
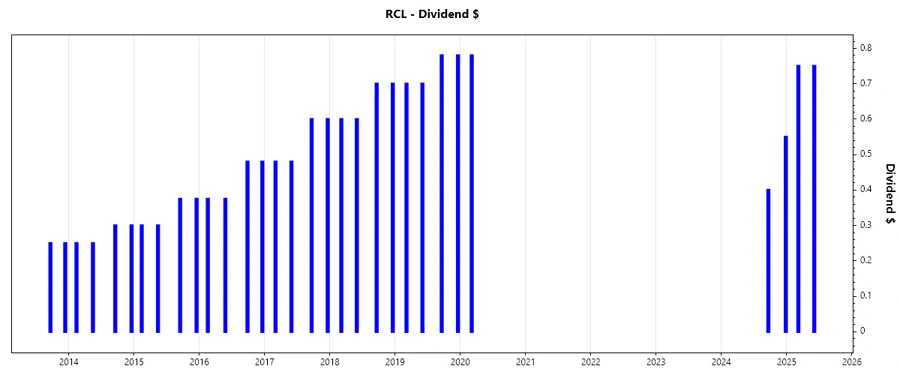
With an extensive track record, Royal Caribbean's dividend history illustrates both its commitment and challenges in maintaining shareholder payouts. Notably, a return to regular payments indicates a recovery trajectory following the 2020 suspension. The 5-year dividend payment trend underscores fluctuating payout levels prior to 2020, influenced by both operational and economic dynamics.
| Year | Dividend Per Share (USD) |
|---|---|
| 2025 | 1.50 |
| 2024 | 0.95 |
| 2020 | 0.78 |
| 2019 | 2.96 |
| 2018 | 2.60 |
📈 Dividend Growth
Understanding dividend growth is crucial for evaluating potential future return on investment. Despite a promising 6.79% growth over the last three years, the five-year metric reveals a decline of -20.33%, indicating volatility and prior operational challenges.
| Time | Growth (%) |
|---|---|
| 3 years | 6.79% |
| 5 years | -20.33% |
The average dividend growth is -20.33 % over 5 years. This shows moderate but steady dividend growth.
📉 Payout Ratio
Royal Caribbean's payout ratios stand crucial in understanding financial prudence and sustainability. With an exceptionally low EPS-based payout ratio of 3.09% and a similar free cash flow (FCF)-based ratio of 3.10%, the company appears to be conservative in reinvesting earnings, paving the way for future resilience amidst market uncertainties.
| Key figure ratio | Value |
|---|---|
| EPS-based | 3.09 % |
| Free cash flow-based | 3.10 % |
The EPS and FCF payout ratios illustrate cautious fiscal management, suggesting adequate retained earnings to fund future growth and potential economic downturns.
⚠️ Cashflow & Capital Efficiency
Examining cashflow and capital efficiency provides insights into a company's operational effectiveness and potential to sustain dividends. Metrics like Free Cash Flow Yield and Earnings Yield have shown a subdued yet stable performance over recent years, indicative of improvements post-pandemic strains.
| Year | 2024 | 2023 | 2022 |
|---|---|---|---|
| Free Cash Flow Yield | 3.32% | 1.75% | -17.68% |
| Earnings Yield | 4.78% | 5.12% | -17.10% |
| CAPEX to Operating Cash Flow | 62.07% | 87.04% | 563.41% |
| Stock-based Compensation to Revenue | 1.62% | 0.91% | 0.41% |
| Free Cash Flow / Operating Cash Flow Ratio | 37.93% | 12.95% | -463.41% |
The overall analysis reflects moderate capital utilization with signs of recovery, although previous periods indicate significant strains necessitating cautious optimism.
⚖️ Balance Sheet & Leverage Analysis
The leverage ratios and other balance sheet metrics offer insights into Royal Caribbean's fiscal stability and flexibility. High leverage ratios indicate substantial debt management challenges, though improvements in recent years may hint at strategic refinancing.
| Year | 2024 | 2023 | 2022 |
|---|---|---|---|
| Debt-to-Equity | 2.75 | 4.68 | 8.36 |
| Debt-to-Assets | 56.16% | 62.99% | 71.04% |
| Debt-to-Capital | 73.35% | 82.41% | 89.32% |
| Net Debt to EBITDA | 3.36 | 4.74 | 35.87 |
| Current Ratio | 0.17 | 0.19 | 0.37 |
| Quick Ratio | 0.15 | 0.16 | 0.35 |
| Financial Leverage | 4.90 | 7.44 | 11.77 |
Despite recent strategic debt reduction, the current financial structure necessitates ongoing monitoring to ensure sustainable leverage and liquidity management.
📊 Fundamental Strength & Profitability
Evaluating Royal Caribbean's profitability and return metrics helps assess its capacity for generating returns on equity (ROE) and assets (ROA). Improving margins provide an optimistic outlook for sustained performance amidst operational challenges and regulatory dynamics.
| Year | 2024 | 2023 | 2022 |
|---|---|---|---|
| Return on Equity | 38.04% | 35.92% | -75.15% |
| Return on Assets | 7.76% | 4.83% | -6.38% |
| Margins: Net | 17.45% | 12.21% | -24.39% |
| Margins: EBIT | 27.22% | 22.35% | -8.96% |
| Margins: EBITDA | 36.92% | 32.81% | 6.96% |
While ongoing operational recovery is observed, the historical profitability profile underscores strategic challenges, requiring adaptation and innovation for future gains.
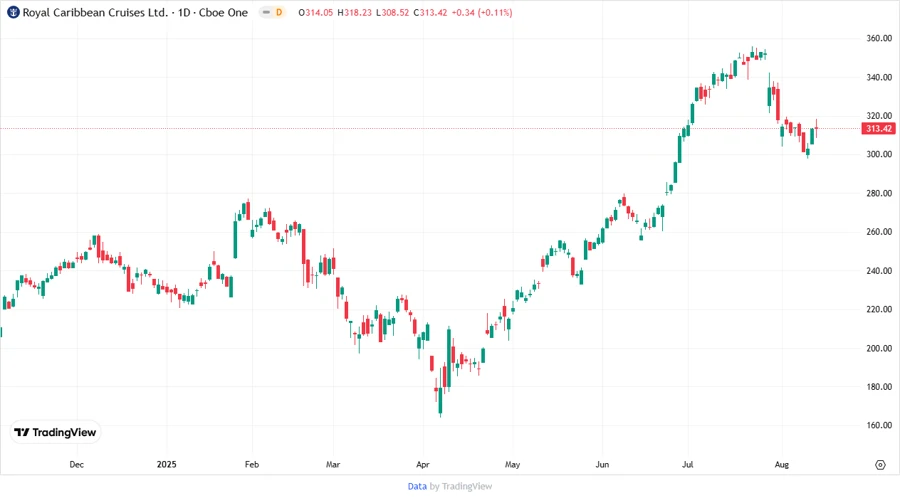
📌 Price Development
🎯 Dividend Scoring System
| Category | Score | Score Bar |
|---|---|---|
| Dividend yield | 2 | |
| Dividend Stability | 3 | |
| Dividend growth | 2 | |
| Payout ratio | 4 | |
| Financial stability | 3 | |
| Dividend continuity | 3 | |
| Cashflow Coverage | 3 | |
| Balance Sheet Quality | 2 |
Total Score: 22/40
✅ Rating
Royal Caribbean Cruises Ltd. exhibits a mixed dividend profile characterized by low current yields yet potential for future growth as the travel industry continues to recover. With a comprehensive oversight on financial and operational performance, the company stands poised to capitalize on opportunities while navigating the complexities of market dynamics. Caution is warranted, but for patient investors, Royal Caribbean presents an intriguing investment option.
Smart Data Insight
Master the Perfect Entry & Exit for this Stock
Don't leave your profits to chance. Historically, this stock follows specific seasonal patterns that institutional traders use to maximize returns.
- ✅ Identify the "Golden Buying Window"
- ✅ Avoid high-risk correction cycles
- ✅ Backtested data from the last 20+ years