June 12, 2025 a 07:46 am

RCL: Dividend Analysis - Royal Caribbean Cruises Ltd.
Royal Caribbean Cruises Ltd. presents a complex dividend profile characterized by moderate yield and historically fluctuating dividend growth. With a market cap exceeding $72 billion, the firm has upheld a 28-year dividend history, though it did experience a suspension in 2020. Analysts observe that, despite these challenges, the payout ratios remain conservative, which may be an indicator of solid future payouts.
Overview
Royal Caribbean Cruises Ltd. remains a resilient player within its sector, navigating the turbulent waters of dividend sustainability and performance. The company's commitment to shareholder returns is evidenced through consistent dividend yields alongside strategic dividend adjustments.
| Parameter | Detail |
|---|---|
| Sector | Consumer Cyclical |
| Dividend yield | 0.77% |
| Current dividend per share | 0.41 USD |
| Dividend history | 28 years |
| Last cut or suspension | 2020 |
Dividend History
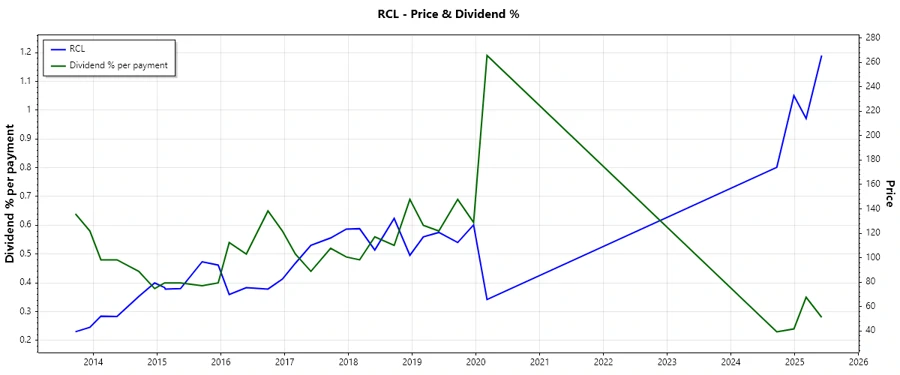
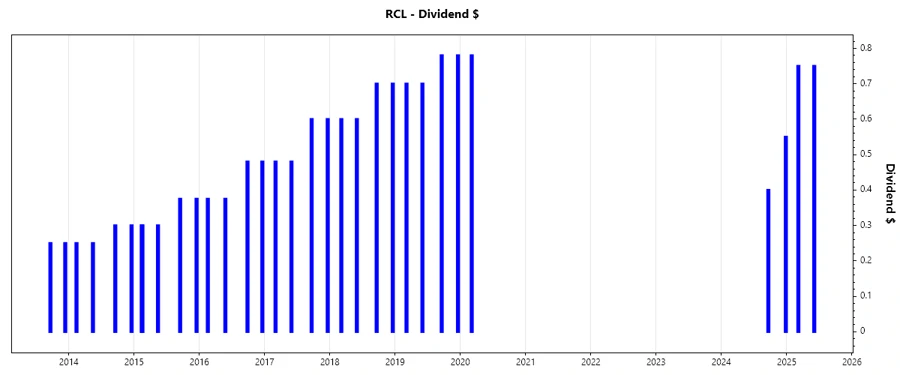
The firm's ability to preserve a long-term dividend history underlines its dedication to consistent shareholder remuneration. Despite the 2020 suspension, the dividends have gradually returned, reflecting management's commitment to balance financial health and investor returns.
| Year | Dividend Per Share (USD) |
|---|---|
| 2025 | 1.50 |
| 2024 | 0.95 |
| 2020 | 0.78 |
| 2019 | 2.96 |
| 2018 | 2.60 |
Dividend Growth
The growth rates across the 3-year show small uptick post-recession recovery while a post-5-year view shows a decline following the pandemic impacts. The firm’s strategic realignment toward dividend prioritization is meant to stabilize these figures for anticipated growth.
| Time | Growth |
|---|---|
| 3 years | 6.79% |
| 5 years | -20.33% |
The average dividend growth is -20.33% over 5 years. This shows moderate but steady dividend growth focus amidst historical challenges.
Payout Ratio
The payout ratio serves as a critical indicator of the sustainability of dividends in relation to the company's net income and cash flows. A conservative approach, as reflected in RCL's metrics, suggests an alignment toward maintaining dividend consistency.
| Key Figure | Ratio |
|---|---|
| EPS-based | 3.40% |
| Free cash flow-based | 5.28% |
With an EPS-based payout ratio of 3.40% and an FCF-based ratio of 5.28%, RCL displays a cautious fiscal policy, enabling flexibility to increase dividends when financially favorable.
Cashflow & Capital Efficiency
An evaluation of cash flow and capital efficiency metrics reveals the company's operational and fiscal agility. Tracking ratios over years indicates cash flow steadiness and capital usage proportionality with revenue generation.
| Metric | 2024 | 2023 | 2022 |
|---|---|---|---|
| Free Cash Flow Yield | 3.32% | 1.75% | -17.68% |
| Earnings Yield | 4.78% | 5.12% | -17.10% |
| CAPEX to Operating Cash Flow | 62.08% | 87.04% | 563.41% |
| Stock-based Compensation to Revenue | 1.62% | 0.91% | 0.41% |
| Free Cash Flow / Operating Cash Flow Ratio | 37.93% | 12.96% | -463.41% |
The cash flows, when analyzed alongside capital efficiency, accentuate the company's cautious investment strategy to streamline operations and refine capital recycling.
Balance Sheet & Leverage Analysis
Balance sheet assessments depict leverage levels and debt compositions, illuminating credit risk exposure.
| Metric | 2024 | 2023 | 2022 |
|---|---|---|---|
| Debt-to-Equity | 2.75 | 4.68 | 8.36 |
| Debt-to-Assets | 56.16% | 62.99% | 71.04% |
| Debt-to-Capital | 73.35% | 82.41% | 89.32% |
| Net Debt to EBITDA | 3.36 | 4.74 | 35.87 |
| Current Ratio | 0.18 | 0.19 | 0.37 |
| Quick Ratio | 0.15 | 0.16 | 0.35 |
| Financial Leverage | 4.90 | 7.44 | 11.77 |
The balance sheet structure informs the leverage decisions, evidencing improved ratios indicating stronger financial footing year-on-year.
Fundamental Strength & Profitability
Examining profitability metrics allows insights into the firm’s potential to generate profit relative to its shareholders' equity and assets.
| Metric | 2024 | 2023 | 2022 |
|---|---|---|---|
| Return on Equity | 38.04% | 35.92% | -75.15% |
| Return on Assets | 7.76% | 4.83% | -6.38% |
| Margins: Net | 17.45% | 12.21% | -24.39% |
| Margins: EBIT | 27.22% | 22.35% | -8.96% |
| Margins: EBITDA | 36.92% | 32.81% | 6.96% |
| Margins: Gross | 47.52% | 44.06% | 25.16% |
| Research & Development to Revenue | 0% | 0% | 0% |
While profitability has seen fluctuations, recent rebounds reveal strategic maneuvers to optimize shareholder returns and enhance core operations.
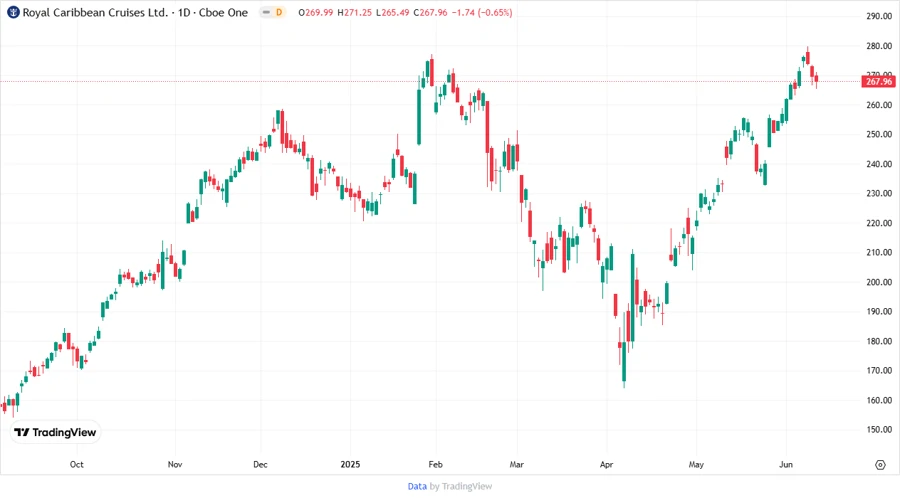
Price Development
Dividend Scoring System
| Category | Description | Score |
|---|---|---|
| Dividend yield | ||
| Dividend Stability | ||
| Dividend growth | ||
| Payout ratio | ||
| Financial stability | ||
| Dividend continuity | ||
| Cashflow Coverage | ||
| Balance Sheet Quality |
Total Score: 24/40
Rating
Royal Caribbean Cruises Ltd. offers a moderate dividend yield with promising stability and sustainable payout ratios. The current dividend prospects are best suited for investors emphasizing long-term recovery potentials, underpinned by improving financial frameworks. Thus, considered as a speculative addition for dividend-focused investment portfolios.
Smart Data Insight
Master the Perfect Entry & Exit for this Stock
Don't leave your profits to chance. Historically, this stock follows specific seasonal patterns that institutional traders use to maximize returns.
- ✅ Identify the "Golden Buying Window"
- ✅ Avoid high-risk correction cycles
- ✅ Backtested data from the last 20+ years