May 23, 2025 a 12:46 pm

RCL: Dividend Analysis - Royal Caribbean Cruises Ltd.
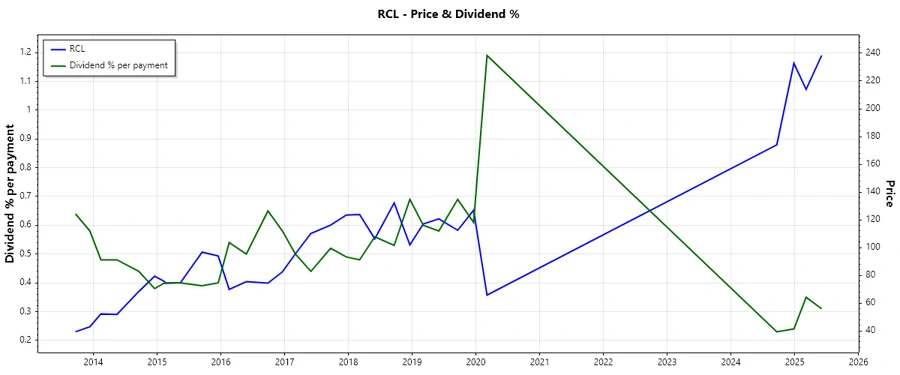
Royal Caribbean Cruises Ltd. presents a moderate dividend profile with a current yield of 0.86% and a lengthy dividend history of 28 years. Despite encountering a cut in 2020, the company's dividends have begun to recover. With a market cap of $64.74 billion, the company showcases resilience in the cruise industry despite past challenges.
Overview 📊
Analyzing the overview of Royal Caribbean's dividend metrics reveals enduring stability within its sector. As a leader in hospitality, the company maintains a dividend yield of 0.86%, reflecting cautious optimism amidst market recovery.
| Sector | Dividend Yield (%) | Current Dividend Per Share (USD) | Dividend History (Years) | Last Cut or Suspension |
|---|---|---|---|---|
| Hospitality | 0.86 | 0.41 | 28 | 2020 |
Dividend History 🗣️
Royal Caribbean's dividend history demonstrates resilience with a span of nearly three decades. This commitment to returning value to shareholders is pivotal for maintaining investor trust and long-term stock performance.
| Year | Dividend Per Share (USD) |
|---|---|
| 2025 | 1.50 |
| 2024 | 0.95 |
| 2020 | 0.78 |
| 2019 | 2.96 |
| 2018 | 2.6 |
Dividend Growth 📈
The trend in dividend growth highlights a transition. Despite a decline of 20.33% over the past five years, the more recent figures suggest a potential recovery and stabilization.
| Time | Growth (%) |
|---|---|
| 3 years | 6.79 |
| 5 years | -20.33 |
The average dividend growth is -20.33% over 5 years. This shows a challenging period with gradual recovery potential.
Payout Ratio 📉
The payout ratios provide insight into sustainability. A low EPS-based payout ratio of 3.40% and a FCF-based ratio of 5.28% indicate strong coverage and a conservative approach to payout commitments.
| Key Figure | Ratio (%) |
|---|---|
| EPS-based | 3.40 |
| Free cash flow-based | 5.28 |
With low payout ratios, the dividend appears to be well-covered, suggesting safety in sustaining these payouts.
Cashflow & Capital Efficiency ✅
An analysis of cash flow and capital efficiency underscores the firm's operational competence. The free cash flow to operating cash flow ratio stands at 0.38, indicative of robust cash usage efficiency.
| Metric | 2024 | 2023 | 2022 |
|---|---|---|---|
| Free Cash Flow Yield | 3.32% | 1.75% | -17.68% |
| Earnings Yield | 4.78% | 5.12% | -17.10% |
| CAPEX to Operating Cash Flow | 62.08% | 87.04% | 563.41% |
| Stock-based Compensation to Revenue | 1.62% | 0.91% | 0.41% |
| Free Cash Flow / Operating Cash Flow Ratio | 0.38 | 0.13 | -4.63 |
The historical cash flow analysis emphasizes cash preservation measures, despite the challenges presented in recent years, reflecting a cautious yet effective capital allocation strategy.
Balance Sheet & Leverage Analysis ⚠️
Balance sheet leverage and liquidity metrics reveal substantial reliance on debt, with the Debt-to-Equity ratio peaking in 2022. However, declines in 2024 illustrate a move towards better financial health.
| Metric | 2024 | 2023 | 2022 |
|---|---|---|---|
| Debt-to-Equity | 2.75 | 4.68 | 8.36 |
| Debt-to-Assets | 0.56 | 0.63 | 0.71 |
| Debt-to-Capital | 0.73 | 0.82 | 0.89 |
| Net Debt to EBITDA | 3.36 | 4.74 | 35.87 |
| Current Ratio | 0.17 | 0.19 | 0.37 |
| Quick Ratio | 0.15 | 0.16 | 0.35 |
| Financial Leverage | 4.90 | 7.44 | 11.77 |
The balance sheet highlights considerable leverage, suggesting ongoing financial restructuring efforts to address these debt levels in light of core operational cash flows.
Fundamental Strength & Profitability 📉
Reviewing fundamentals and profitability metrics, Royal Caribbean's rebound in 2023 and 2024 illustrates swift progress from 2022's downturn.
| Metric | 2024 | 2023 | 2022 |
|---|---|---|---|
| Return on Equity | 38.04% | 35.92% | -75.15% |
| Return on Assets | 7.76% | 4.83% | -6.38% |
| ROIC | 14.19% | 10.46% | -2.80% |
| Net Margin | 17.45% | 12.21% | -24.39% |
| EBIT Margin | 27.22% | 22.35% | -8.96% |
| EBITDA Margin | 36.92% | 32.81% | 6.96% |
| Gross Margin | 47.52% | 44.06% | 25.16% |
| R&D to Revenue | 0.00% | 0.00% | 0.00% |
Despite past volatility, the recent performance underlines a commendable recovery effort, with profitability resurging in alignment with strategic cost management and operational efficiencies.
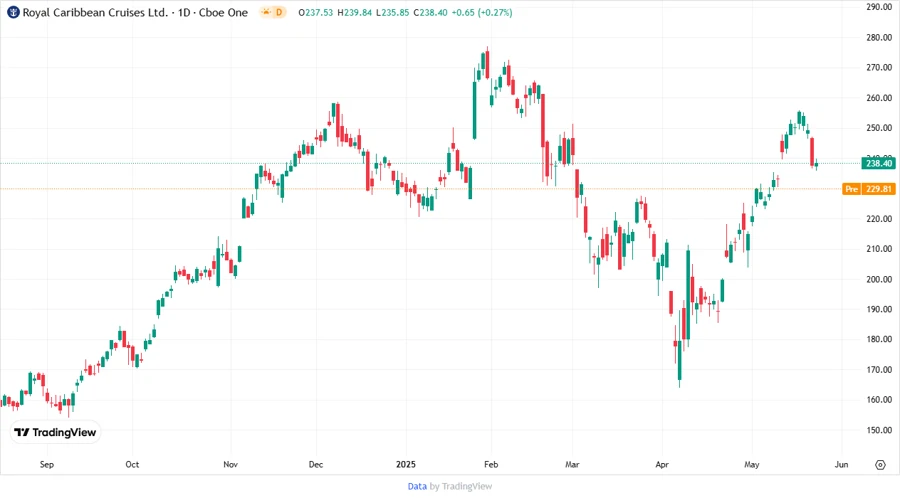
Price Development 📈
Dividend Scoring System 🏆
| Category | Score | Score Bar |
|---|---|---|
| Dividend Yield | 3 | |
| Dividend Stability | 4 | |
| Dividend Growth | 2 | |
| Payout Ratio | 5 | |
| Financial Stability | 3 | |
| Dividend Continuity | 3 | |
| Cashflow Coverage | 4 | |
| Balance Sheet Quality | 3 |
Total Score: 27/40
Rating 🗣️
Royal Caribbean Cruises Ltd. stands out as a compelling entity for dividend-oriented investors due to its historically stable payouts, albeit facing recent growth challenges. The company's dividend resumption showcases its intent to rebound and renew shareholder value. Cautious optimism is recommended, keeping in view potential market and operational dynamics.
Smart Data Insight
Master the Perfect Entry & Exit for this Stock
Don't leave your profits to chance. Historically, this stock follows specific seasonal patterns that institutional traders use to maximize returns.
- ✅ Identify the "Golden Buying Window"
- ✅ Avoid high-risk correction cycles
- ✅ Backtested data from the last 20+ years