
July 15, 2026 a 06:00 pm
QCOM: Fundamental Ratio Analysis - QUALCOMM Incorporated
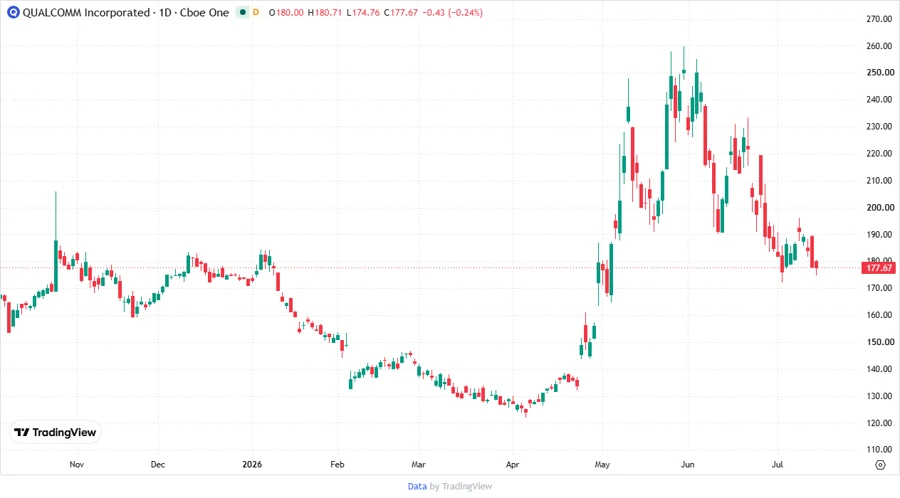
QUALCOMM Incorporated is a leader in the wireless communication industry, leveraging its extensive patent portfolio to capture revenue through technology licensing and investments in emerging technologies. As of the latest evaluation, the company demonstrates robust financial health, making it an attractive option for tech sector investors.
Fundamental Rating
The current fundamental rating suggests strong overall performance with a high return on equity and assets.
| Category | Score | |
|---|---|---|
| Discounted Cash Flow | 3 | |
| Return on Equity | 5 | |
| Return on Assets | 5 | |
| Debt to Equity | 2 | |
| Price to Earnings | 3 | |
| Price to Book | 2 |
Historical Rating
The historical trend showcases consistent scores highlighting stability in key financial metrics over time.
| Date | Overall | DCF | ROE | ROA | D/E | P/E | P/B |
|---|---|---|---|---|---|---|---|
| 2026-07-15 | 4 | 3 | 5 | 5 | 2 | 3 | 2 |
| Historical | 0 | 3 | 5 | 5 | 2 | 3 | 2 |
Analyst Price Targets
Analyst estimations position QUALCOMM in a promising stance, with consistent median price targets suggesting stable returns.
| High | Low | Median | Consensus |
|---|---|---|---|
| $300 | $120 | $220 | $218.5 |
Analyst Sentiment
With a majority leaning towards a 'Hold', analysts show cautious optimism.
| Recommendation | Count | |
|---|---|---|
| Strong Buy | 1 | |
| Buy | 29 | |
| Hold | 34 | |
| Sell | 5 | |
| Strong Sell | 0 |
Conclusion
QUALCOMM continues to assert its dominance in the tech sector with strong financials and a solid foothold in emerging technologies. The firm's strategic investments in 5G and AI bolster its growth outlook, although intensifying market competition poses risks. With overall stable analyst ratings and a 'Hold' consensus, it offers opportunities for investors seeking steady returns. However, monitoring ongoing developments in technology licensing and regulatory shifts is essential. Overall, QUALCOMM presents balanced prospects with promising potential for future innovation.
Smart Data Insight
Master the Perfect Entry & Exit for this Stock
Don't leave your profits to chance. Historically, this stock follows specific seasonal patterns that institutional traders use to maximize returns.
- ✅ Identify the "Golden Buying Window"
- ✅ Avoid high-risk correction cycles
- ✅ Backtested data from the last 20+ years