
June 07, 2026 a 11:43 am

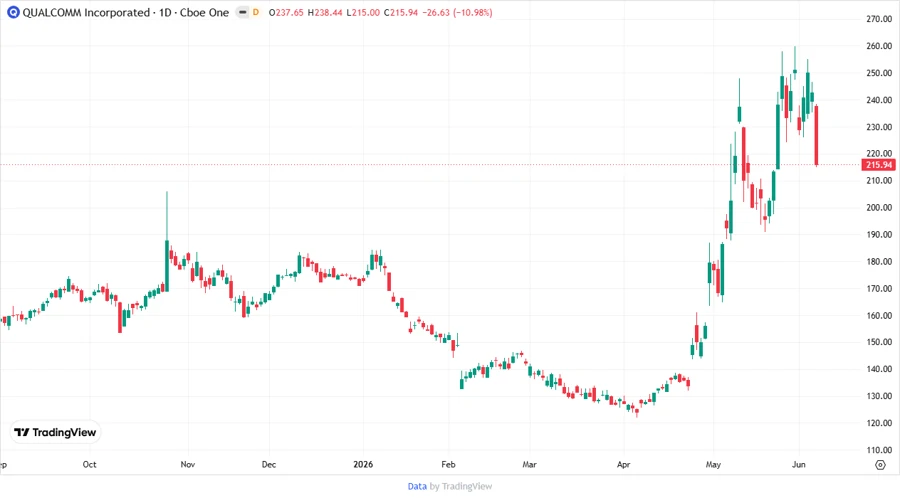
QCOM: Fundamental Ratio Analysis - QUALCOMM Incorporated
QUALCOMM Incorporated, a leading company in the wireless technology sector, presents a firm stance with consistent scores in its fundamental analysis. The stock is backed by its strong technological advancements and licensing portfolio, showing resilience in volatile markets. However, market competition and technological shifts present challenges.
Fundamental Rating
The fundamental analysis of QUALCOMM suggests stability with a few areas for improvement. The scores reflect the company's strong performance in key financial metrics.
| Category | Score | Visualization |
|---|---|---|
| Discounted Cash Flow | 4 | |
| Return On Equity | 5 | |
| Return On Assets | 5 | |
| Debt To Equity | 2 | |
| Price To Earnings | 3 | |
| Price To Book | 2 |
Historical Rating
The historical scores show consistency over time, indicating stable performance in key metrics.
| Date | Overall | DCF | ROE | ROA | D/E | P/E | P/B |
|---|---|---|---|---|---|---|---|
| 2026-06-05 | 4 | 4 | 5 | 5 | 2 | 3 | 2 |
| Previous | 0 | 4 | 5 | 5 | 2 | 3 | 2 |
Analyst Price Targets
Analysts provide a varied price target range, with a consensus reflecting a cautious stance on the stock's growth potential.
| High | Low | Median | Consensus |
|---|---|---|---|
| 300 | 120 | 175 | 187.37 |
Analyst Sentiment
The analyst sentiment showcases a mixed review with a predominant hold consensus, reflecting uncertainty amidst market dynamics.
| Recommendation | Count | Visualization |
|---|---|---|
| Strong Buy | 1 | |
| Buy | 30 | |
| Hold | 34 | |
| Sell | 4 | |
| Strong Sell | 0 |
Conclusion
QUALCOMM Incorporated continues to thrive as a leader in wireless technology with a solid financial foundation. The company's robust licensing and product portfolio bolster its market position. However, increasing competition and rapid technological advancements pose potential risks. The stock's analyst sentiment suggests a cautious approach, aligning with the mixed fundamental ratings. Investors may consider monitoring industry trends closely when evaluating investment opportunities in QUALCOMM.
Smart Data Insight
Master the Perfect Entry & Exit for this Stock
Don't leave your profits to chance. Historically, this stock follows specific seasonal patterns that institutional traders use to maximize returns.
- ✅ Identify the "Golden Buying Window"
- ✅ Avoid high-risk correction cycles
- ✅ Backtested data from the last 20+ years