
May 26, 2026 a 08:00 am

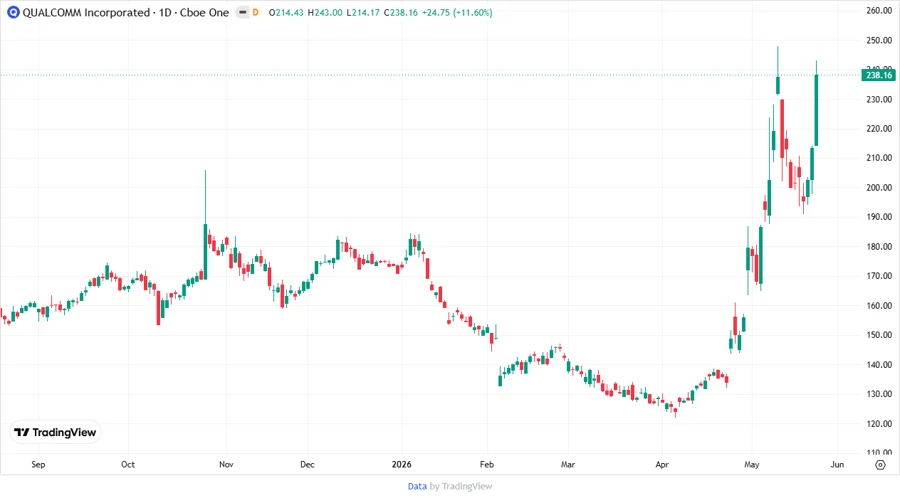
QCOM: Fundamental Ratio Analysis - QUALCOMM Incorporated
Qualcomm Incorporated is a leading player in the wireless industry, known for its technological innovation and strategic initiatives in 5G, AI, and IoT. The company has a diverse segment portfolio that contributes to its robust market position. Investing in QCOM stock offers both opportunities and challenges based on its market environment and strategic developments.
Fundamental Rating
Qualcomm exhibits strong fundamentals with a solid overall rating and impressive scores in return metrics, although slightly weaker in debt and book value metrics.
| Category | Score | Visualization |
|---|---|---|
| Discounted Cash Flow | 4 | |
| Return On Equity | 5 | |
| Return On Assets | 5 | |
| Debt To Equity | 2 | |
| Price To Earnings | 3 | |
| Price To Book | 2 |
Historical Rating
Analyzing past scores helps in understanding the company's performance trajectory and provides insights into its future potential.
| Date | Overall Score | DCF | ROE | ROA | D/E | P/E | P/B |
|---|---|---|---|---|---|---|---|
| 2026-05-22 | 4 | 4 | 5 | 5 | 2 | 3 | 2 |
| Historical | 0 | 4 | 5 | 5 | 2 | 3 | 2 |
Analyst Price Targets
Analyst price targets give a snapshot of expected stock performance, offering insight into market confidence and sentiment about QCOM's financial future.
| High | Low | Median | Consensus |
|---|---|---|---|
| $300 | $120 | $175 | $187.37 |
Analyst Sentiment
The analyst sentiment illustrates the general opinion and recommendation trends for QCOM stocks, which is a vital indicator for potential buyers and investors.
| Recommendation | Number | Visualization |
|---|---|---|
| Strong Buy | 1 | |
| Buy | 30 | |
| Hold | 34 | |
| Sell | 4 | |
| Strong Sell | 0 |
Conclusion
QUALCOMM Incorporated shows a steady financial performance with strong fundamentals but is slightly hindered by higher debt levels relative to some peers. The company's strategic focus on 5G and AI positions it well for future growth, though market volatility and regulatory challenges remain key risks. Analyst consensus suggests a "Hold" rating, indicating cautious optimism. Overall, QCOM represents a balanced investment opportunity with potential for both gains and limitations.
Smart Data Insight
Master the Perfect Entry & Exit for this Stock
Don't leave your profits to chance. Historically, this stock follows specific seasonal patterns that institutional traders use to maximize returns.
- ✅ Identify the "Golden Buying Window"
- ✅ Avoid high-risk correction cycles
- ✅ Backtested data from the last 20+ years