
July 26, 2026 a 11:44 am
QCOM: Fibonacci Analysis - QUALCOMM Incorporated
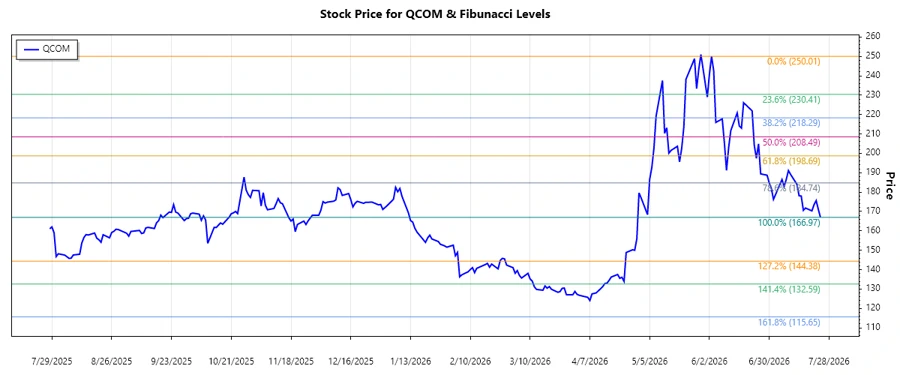
QUALCOMM Incorporated, a leader in wireless communication technologies, has shown a volatile market performance in recent months. With a diverse portfolio spanning integrated circuits, licensing, and strategic investments, QCOM is well-positioned in 5G and IoT sectors. The stock's recent trend indicates a notable decline, potentially uncovering opportunities for strategic investors. The company's innovative drive and broad industry influence underscore its resilience despite market fluctuations.
Fibonacci Analysis
| Feature | Details |
|---|---|
| Start Date | 2026-06-03 |
| End Date | 2026-07-24 |
| High Price | $250.01 (2026-06-03) |
| Low Price | $166.97 (2026-07-24) |
| Fibonacci 0.236 | $186.39 |
| Fibonacci 0.382 | $199.43 |
| Fibonacci 0.5 | $208.49 |
| Fibonacci 0.618 | $217.55 |
| Fibonacci 0.786 | $229.82 |
| Current Price | $166.97 |
| Current Retracement Zone | None (below Fibonacci levels) |
The current price of QCOM is below the calculated Fibonacci levels, indicating that the price is yet to enter a retracement zone. The periods of support or resistance may form around these levels, providing potential strategic entry or exit points for investors.
Conclusion
QUALCOMM Incorporated's recent price decline highlights a challenging phase possibly driven by broader economic factors. While the stock trades beneath key Fibonacci levels, it presents a promising prospect if it manages a rebound. Technical indicators suggest vigilance as the current price is sustained outside retracement zones, implying potential entry points on reversals or further declines. The company's strategic engagements and market leadership in wireless solutions remain strong incentives for long-term investors. However, price volatility and external economic pressures pose inherent risks requiring careful market watch.
Smart Data Insight
Master the Perfect Entry & Exit for this Stock
Don't leave your profits to chance. Historically, this stock follows specific seasonal patterns that institutional traders use to maximize returns.
- ✅ Identify the "Golden Buying Window"
- ✅ Avoid high-risk correction cycles
- ✅ Backtested data from the last 20+ years