May 10, 2026 a 07:46 am

📊 QCOM: Dividend Analysis - QUALCOMM Incorporated
QUALCOMM Incorporated demonstrates a steady dividend policy with a substantial history, solidifying its presence as a reliable player in the semiconductor industry. The company's dividend yield of 1.64% is modest, but the consistent growth over five years highlights its potential for long-term investors. The robust balance sheet and proficient cash flow management further enhance the sustainability of its dividend payments. With a dividend history spanning 25 years and no recent cuts or suspensions, QUALCOMM's dividend profile remains strong, providing confidence to investors.
🏢 Overview
QUALCOMM operates within the technology sector, showcasing a transparent and consistent approach to returns of capital to shareholders through dividends. The company’s dividend yield stands at 1.64% with a current dividend of 3.47 USD per share. Despite economic fluctuations, QUALCOMM has maintained dividend payments for 25 years without any recent cuts, highlighting a stable trajectory for future payments.
| Data Point | Value |
|---|---|
| Sector | Technology |
| Dividend yield | 1.64% |
| Current dividend per share | 3.4717 USD |
| Dividend history | 25 years |
| Last cut or suspension | None |
📆 Dividend History
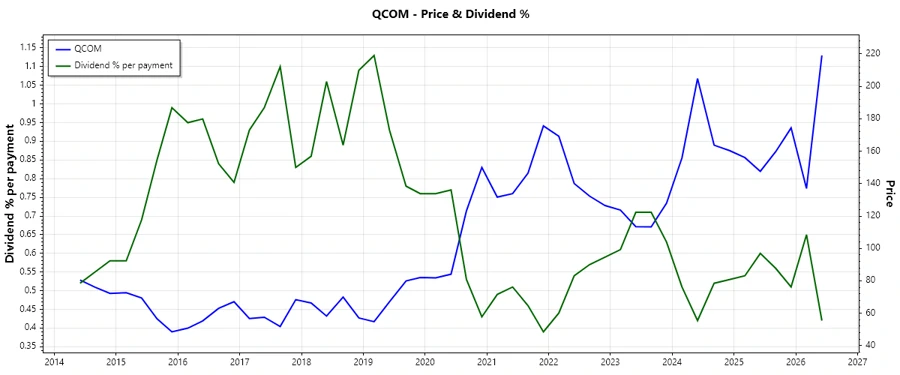
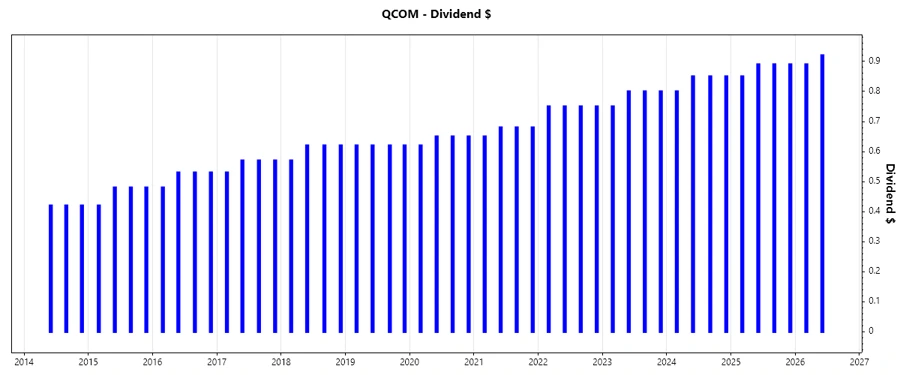
Historical dividend trends provide insights into a company's commitment to returning capital to its shareholders. A consistent dividend record is a sign of a stable financial position, and QUALCOMM's 25-year history underscores its reliable earnings. The yearly payouts demonstrate an increasing trend, reflecting profitable operations and prudent financial management by the company.
| Year | Dividend Per Share (USD) |
|---|---|
| 2026 | 1.81 |
| 2025 | 3.52 |
| 2024 | 3.35 |
| 2023 | 3.15 |
| 2022 | 3.00 |
📈 Dividend Growth
Dividend growth indicates a company’s ability to increase shareholder returns over time, which is vital for measuring its financial health and operational success. QUALCOMM's dividend growth rate stands at approximately 5.47% over the past three years and 6.49% over five years, demonstrating a moderate yet steady increase that appeals to long-term investors seeking income growth.
| Time | Growth |
|---|---|
| 3 years | 5.47% |
| 5 years | 6.49% |
The average dividend growth is 6.49% over 5 years. This shows moderate but steady dividend growth.
💰 Payout Ratio
The payout ratio helps in assessing how much of a company's earnings or free cash flow is being distributed in the form of dividends. With an EPS-based ratio of 37.30% and a FCF-based ratio of 29.27%, QUALCOMM exhibits a sustainable distribution model that leaves room for growth and strategic investments.
| Key figure | Ratio |
|---|---|
| EPS-based | 37.30% |
| Free cash flow-based | 29.27% |
These ratios reflect QUALCOMM's disciplined approach in conserving capital while rewarding shareholders steadily. The modest payout suggests future dividend potential and ample buffer against unpredicted downturns.
📉 Cashflow & Capital Efficiency
Evaluating cash flow and capital efficiency provides clarity on a company’s financial flexibility and capital allocation effectiveness, which are crucial in maintaining its dividend strategy. QUALCOMM's metrics signify robust cash generation and capital deployment, supporting its ability to sustain and potentially increase dividends.
| Year | 2023 | 2024 | 2025 |
|---|---|---|---|
| Free Cash Flow Yield | 5.41% | 5.88% | 7.08% |
| Earnings Yield | 4.25% | 5.34% | 3.06% |
| CAPEX to Operating Cash Flow | 12.48% | 8.53% | 8.51% |
| Stock-based Compensation to Revenue | 5.41% | 6.80% | 6.28% |
| Free Cash Flow/Operating Cash Flow Ratio | 91.49% | 91.47% | 91.49% |
QUALCOMM’s ability to convert operating cash flow to free cash flow efficiently secures its dividend payments, indicating stability in cash flow operations.
🏦 Balance Sheet & Leverage Analysis
The balance sheet and leverage metrics are pivotal to understanding a company's financial soundness and ability to weather economic challenges. QUALCOMM's ratios reflect prudent debt management and solid liquidity, ensuring financial stability and enhancing resilience.
| Year | 2023 | 2024 | 2025 |
|---|---|---|---|
| Debt-to-Equity | 0.74 | 0.59 | 0.77 |
| Debt-to-Assets | 0.31 | 0.28 | 0.33 |
| Debt-to-Capital | 0.43 | 0.37 | 0.44 |
| Net Debt to EBITDA | 0.77 | 0.60 | 0.57 |
| Current Ratio | 2.33 | 2.40 | 2.82 |
| Quick Ratio | 1.67 | 1.79 | 1.94 |
| Financial Leverage | 2.36 | 2.10 | 2.36 |
The stability in leverage and liquidity ratios enables QUALCOMM to maintain a robust financial posture, which is critical for ongoing capital expenditures and dividend safety.
🔍 Fundamental Strength & Profitability
Profitability metrics highlight essential indicators like efficiency, competitiveness, and growth potential. QUALCOMM's strength across various profitability indicators confirms its capacity to generate sustainable profits and maintain robust dividend policies.
| Year | 2023 | 2024 | 2025 |
|---|---|---|---|
| Return on Equity | 40.19% | 38.60% | 26.13% |
| Return on Assets | 17.37% | 18.39% | 11.05% |
| Net Profit Margin | 20.19% | 26.03% | 12.51% |
| EBIT Margin | 22.72% | 28.32% | 30.09% |
| EBITDA Margin | 27.77% | 32.70% | 33.71% |
| Gross Margin | 55.70% | 56.21% | 55.43% |
| Research & Development to Revenue | 21.38% | 22.82% | 20.42% |
QUALCOMM's above-average profit margins and returns signal resilient operational performance, supporting a solid dividend payment capacity.
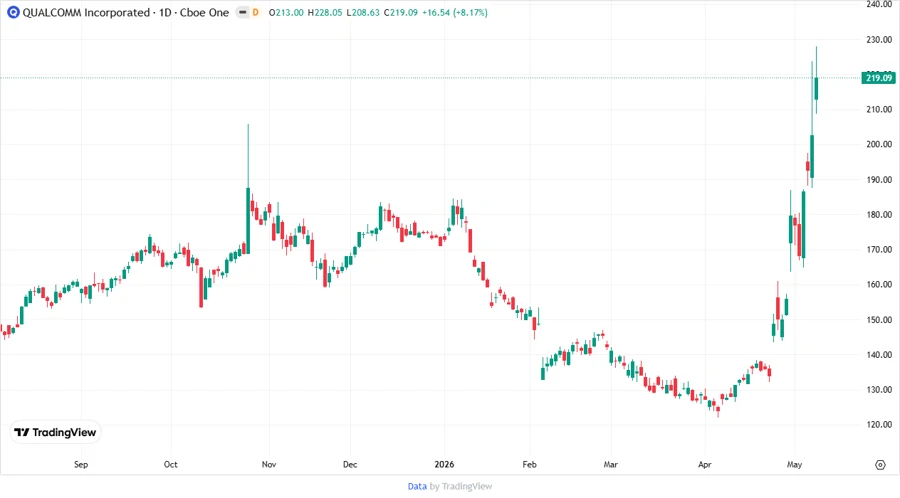
📈 Price Development
✅ Dividend Scoring System
| Criteria | Description | Score |
|---|---|---|
| Dividend Yield | Below industry average. | 3/5 |
| Dividend Stability | 25-year payment history. | 4/5 |
| Dividend Growth | Steady growth over the years. | 3/5 |
| Payout Ratio | Conservative and sustainable. | 3/5 |
| Financial Stability | Strong balance sheet. | 4/5 |
| Dividend Continuity | Reliably consistent payments. | 5/5 |
| Cashflow Coverage | Sufficient coverage for dividends. | 4/5 |
| Balance Sheet Quality | Sound leverage ratios. | 3/5 |
Total Score: 29/40
🔑 Rating
QUALCOMM Incorporated presents a robust profile with consistent dividend payouts, a strong balance sheet, and moderate dividend growth. Although the yield is comparatively lower, its outstanding historical performance and financial stability position it as an attractive choice for investors seeking long-term dividend stability.
Smart Data Insight
Master the Perfect Entry & Exit for this Stock
Don't leave your profits to chance. Historically, this stock follows specific seasonal patterns that institutional traders use to maximize returns.
- ✅ Identify the "Golden Buying Window"
- ✅ Avoid high-risk correction cycles
- ✅ Backtested data from the last 20+ years