February 10, 2026 a 11:31 am

QCOM: Dividend Analysis - QUALCOMM Incorporated
📊 QUALCOMM Incorporated, a significant player in the technology sector, exhibits a robust dividend profile with a consistent dividend history spanning 25 years. The company's current dividend yield is 2.56%, backed by a dividend per share of $3.47. QUALCOMM has not had a recent dividend cut or suspension, indicating strong dividend stability and a commitment to shareholder returns.
Overview
🗣️ QUALCOMM operates in the Semiconductor sector and has shown considerable dividend growth over many years, demonstrating its financial strength and commitment to returning value to its shareholders. For those seeking a stable dividend income, QUALCOMM's track record of 25 years without a suspension is appealing.
| Metric | Data |
|---|---|
| Sector | Semiconductors |
| Dividend Yield | 2.56% |
| Current Dividend Per Share | 3.47 USD |
| Dividend History | 25 years |
| Last Cut or Suspension | None |
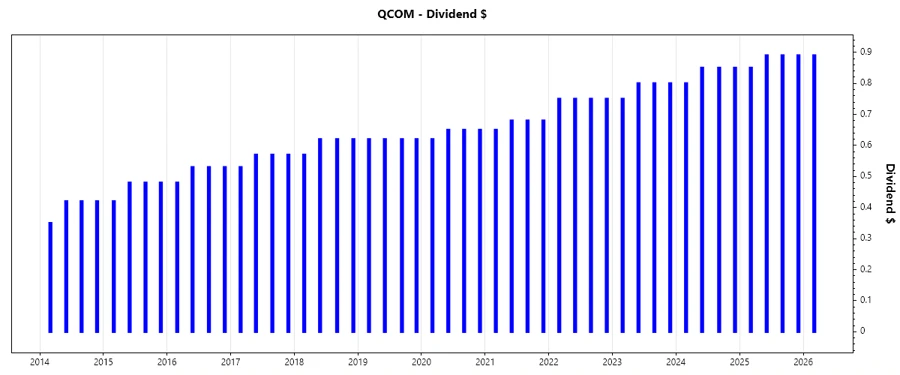
Dividend History
📈 The dividend history is crucial as it reflects the company's ability to generate consistent cash flows and distribute earnings back to its investors. QUALCOMM displays remarkable consistency in dividend payments, which is a strong indicator of financial stability.
| Year | Dividend Per Share (USD) |
|---|---|
| 2026 | 0.89 |
| 2025 | 3.52 |
| 2024 | 3.35 |
| 2023 | 3.15 |
| 2022 | 3.00 |
Dividend Growth
📈 Dividend growth is vital as it demonstrates the company's potential to increase shareholder returns over time. Consistent growth often leads to increased investor confidence and stock price appreciation.
| Time | Growth |
|---|---|
| 3 years | 5.47% |
| 5 years | 6.49% |
✅ The average dividend growth is 6.49% over 5 years. This shows moderate but steady dividend growth, which aligns with the company's strategic financial planning.
Payout Ratio
📉 The payout ratio is a key indicator of the sustainability of dividend payments. It shows the proportion of earnings paid to shareholders as dividends.
| Key figure | Ratio |
|---|---|
| EPS-based | 68.67% |
| Free cash flow-based | 28.92% |
⚠️ An EPS-based payout ratio of 68.67% suggests that a large portion of earnings is distributed as dividends. The lower FCF-based ratio of 28.92% indicates sound financial health, as it shows flexibility in dividend coverage from cash flows.
Cashflow & Capital Efficiency
📊 Evaluating cash flow and capital efficiency indicates a company's ability to manage its operational cash effectively and optimize shareholder value.
| Metric | 2023 | 2024 | 2025 |
|---|---|---|---|
| Free Cash Flow Yield | 7.94% | 5.88% | 7.08% |
| Earnings Yield | 5.83% | 5.34% | 3.06% |
| CAPEX to Operating Cash Flow | 12.83% | 8.53% | 8.51% |
| Stock-based Compensation to Revenue | 6.93% | 6.80% | 6.28% |
| Free Cash Flow / Operating Cash Flow Ratio | 87.17% | 91.47% | 91.49% |
✅ QUALCOMM's ability to generate consistent cash flows and efficiently allocate capital is indicative of strong operational efficiency and offers a solid buffer for dividend payments even during challenging economic periods.
Balance Sheet & Leverage Analysis
📉 A comprehensive analysis of the balance sheet and leverage provides insights into financial solidity, debt management, and the ability to withstand economic downturns.
| Metric | 2023 | 2024 | 2025 |
|---|---|---|---|
| Debt-to-Equity | 74.45% | 58.77% | 69.84% |
| Debt-to-Assets | 31.48% | 27.99% | 29.54% |
| Debt-to-Capital | 42.68% | 37.01% | 41.12% |
| Net Debt to EBITDA | 0.77 | 0.60 | 0.62 |
| Current Ratio | 2.33 | 2.40 | 2.82 |
| Quick Ratio | 1.67 | 1.79 | 2.10 |
| Financial Leverage | 2.37 | 2.10 | 2.36 |
⚠️ While the debt ratios show some leverage, the strong current and quick ratios highlight QUALCOMM's capability to meet obligations and maintain liquidity, underscoring a well-balanced financial structure.
Fundamental Strength & Profitability
📈 Key profitability and efficiency ratios signal a company’s capacity to generate significant returns, manage costs, and sustain long-term growth.
| Metric | 2023 | 2024 | 2025 |
|---|---|---|---|
| Return on Equity | 33.51% | 38.60% | 26.13% |
| Return on Assets | 14.17% | 18.39% | 11.05% |
| Net Margin | 20.19% | 26.03% | 12.51% |
| EBIT Margin | 22.72% | 28.32% | 30.09% |
| EBITDA Margin | 27.77% | 32.70% | 33.71% |
| Gross Margin | 55.70% | 56.21% | 55.43% |
| R&D to Revenue | 24.62% | 22.82% | 20.42% |
✅ QUALCOMM's profitability ratios illuminate a firm that is capable of converting revenues into considerable profits effectively, with strong margins and returns on equity and assets.
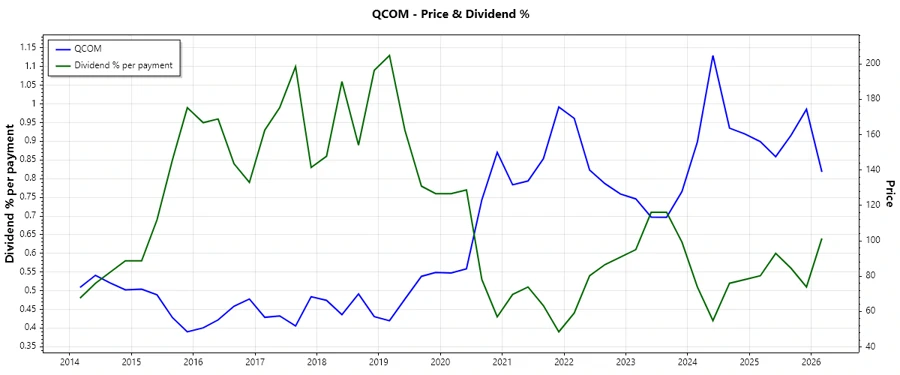
Price Development
Dividend Scoring System
| Category | Score (1-5) | Score Bar |
|---|---|---|
| Dividend Yield | 4 | |
| Dividend Stability | 5 | |
| Dividend Growth | 3 | |
| Payout Ratio | 3 | |
| Financial Stability | 4 | |
| Dividend Continuity | 5 | |
| Cashflow Coverage | 4 | |
| Balance Sheet Quality | 4 |
Overall Score: 32/40
Rating
🗣️ QUALCOMM Incorporated exhibits robust dividend fundamentals with stable financial metrics, making it a viable option for income-focused investors. Given the company’s strong dividend history and growth potential, QUALCOMM is recommended as a buy for those seeking long-term income generation and capital appreciation.
Smart Data Insight
Master the Perfect Entry & Exit for this Stock
Don't leave your profits to chance. Historically, this stock follows specific seasonal patterns that institutional traders use to maximize returns.
- ✅ Identify the "Golden Buying Window"
- ✅ Avoid high-risk correction cycles
- ✅ Backtested data from the last 20+ years