June 15, 2025 a 07:46 am


QCOM: Dividend Analysis - QUALCOMM Incorporated
Qualcomm, a prominent leader in the technology sector, offers a compelling dividend profile. With a commendable history of dividend stability, the company presents steady, albeit moderate, growth in its payouts. Their robust financial fundamentals, combined with strategic investments in innovation, make them a noteworthy consideration for dividend-centric investors. Yet, investors should weigh this against potential market volatilities affecting the technology sector.
📊 Overview
QUALCOMM Incorporated stands outstanding in the semiconductor industry, offering a promising dividend yield of 2.33%. With a current dividend of 3.30 USD per share and a steadfast dividend history spanning 24 years, Qualcomm exhibits remarkable stability with no recent dividend cuts or suspensions. These attributes underscore its reliability as a dividend-paying entity in a volatile market.
| Metric | Details |
|---|---|
| Sector | Semiconductors |
| Dividend Yield | 2.33% |
| Current Dividend per Share | 3.30 USD |
| Dividend History | 24 years |
| Last Cut or Suspension | None |
📈 Dividend History
Qualcomm's dividend history reflects its dedication to provide consistent returns to shareholders. This stability is critical for investment planning, offering predictability in income from dividend payments. By comparing past and recent payouts, investors can gauge the company's commitment to shareholder returns and confidence in its financial health.
| Year | Dividend per Share |
|---|---|
| 2025 | 1.74 USD |
| 2024 | 3.35 USD |
| 2023 | 3.15 USD |
| 2022 | 2.93 USD |
| 2021 | 2.69 USD |
📊 Dividend Growth
The dividend growth rate serves as an indicator of a company's potential for long-term income enhancement for investors. Positive growth rates over multiple years reflect a company's robust financial strategy and operational execution.
| Time | Growth |
|---|---|
| 3 years | 7.59% |
| 5 years | 6.20% |
The average dividend growth is 6.20% over 5 years. This shows moderate but steady dividend growth.
📉 Payout Ratio
A key measure of dividend sustainability, the payout ratio showcases a company's ability to cover its dividend payments. It's prudent to consider a company's earnings and free cash flow payout ratios when assessing its long-term dividend commitment.
| Key Figure | Ratio |
|---|---|
| EPS-based | 33.03% |
| Free Cash Flow-based | 30.99% |
With an EPS payout ratio of 33.03% and a free cash flow payout ratio of 30.99%, Qualcomm maintains a safe margin for sustaining its dividends, indicating strong earnings support for its payouts.
💵 Cashflow & Capital Efficiency
Cash flow and capital efficiency are integral to understanding a company's operational strength and ability to fund dividends. Adequate free cash flow ensures that a company can reinvest in its business and reward shareholders simultaneously.
| Year | 2024 | 2023 | 2022 |
|---|---|---|---|
| Free Cash Flow Yield | 5.88% | 7.98% | 5.08% |
| Earnings Yield | 5.34% | 5.86% | 9.62% |
| CAPEX to Operating Cash Flow | 8.53% | 12.83% | 24.87% |
| Stock-based Compensation to Revenue | 6.80% | 6.93% | 4.60% |
| Free Cash Flow / Operating Cash Flow Ratio | 91.47% | 87.17% | 75.13% |
QUALCOMM's financial positioning indicates proficient capital use, providing significant buffers for investments and dividends. The low CAPEX to Operating Cash Flow ratio suggests strategic resource allocation without compromising growth or shareholder returns.
📊 Balance Sheet & Leverage Analysis
The balance sheet is a reflection of a company's financial foundation, showing its leverage and liquidity risk levels. Sound financials imply flexibility to endure economic upheavals and sustain dividends.
| Year | 2024 | 2023 | 2022 |
|---|---|---|---|
| Debt-to-Equity | 55.70% | 71.35% | 85.95% |
| Debt-to-Assets | 26.53% | 30.17% | 31.59% |
| Debt-to-Capital | 35.77% | 41.64% | 46.22% |
| Net Debt to EBITDA | 0.53 | 0.66 | 0.77 |
| Current Ratio | 2.40 | 2.33 | 1.75 |
| Quick Ratio | 1.79 | 1.67 | 1.21 |
| Financial Leverage | 2.10 | 2.37 | 2.72 |
With prudent leverage practices, Qualcomm is well-poised to manage debt obligations effectively. The improving debt metrics and robust quick ratio reflect a sound liquidity position, which bolsters financial stability.
📈 Fundamental Strength & Profitability
Fundamental strengths and profitability levels are decisive factors for assessing long-term investment potential. High returns on equity and assets suggest optimal operational efficiency, driving shareholder value.
| Year | 2024 | 2023 | 2022 |
|---|---|---|---|
| Return on Equity | 38.60% | 33.51% | 71.81% |
| Return on Assets | 18.39% | 14.17% | 26.39% |
| Margins: Net | 26.03% | 20.19% | 29.27% |
| Margins: EBIT | 28.32% | 22.72% | 35.04% |
| Margins: EBITDA | 32.70% | 29.20% | 37.47% |
| Margins: Gross | 56.21% | 55.70% | 57.84% |
| R&D to Revenue | 21.30% | 24.62% | 18.54% |
Exceptional ROE and solid profit margins signify Qualcomm's operational efficacy and strategic positioning in the market. A sustained focus on research and development evidences its commitment to innovation.
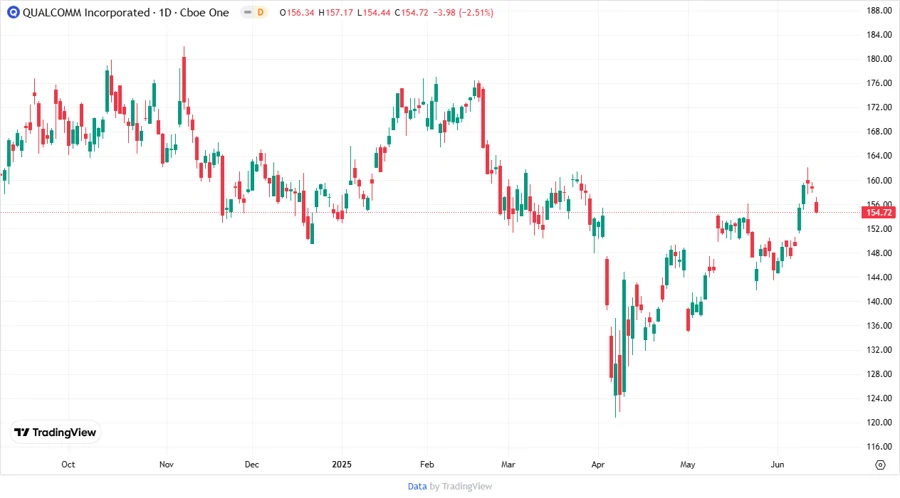
💹 Price Development
🔍 Dividend Scoring System
| Criteria | Score | |
|---|---|---|
| Dividend Yield | 4 | |
| Dividend Stability | 5 | |
| Dividend Growth | 3 | |
| Payout Ratio | 4 | |
| Financial Stability | 4 | |
| Dividend Continuity | 5 | |
| Cashflow Coverage | 4 | |
| Balance Sheet Quality | 4 |
Overall Score: 33/40
⭐ Rating
QUALCOMM Incorporated garners a strong investment appeal for income-focused investors. With a comprehensive dividend profile balanced by prudent financial management and strategic growth initiatives, Qualcomm is positioned as a reliable entity for sustained dividend returns. Given its moderate growth coupled with strong financial metrics, the company receives a sound recommendation for long-term investors attentive to dividend reliability.
Smart Data Insight
Master the Perfect Entry & Exit for this Stock
Don't leave your profits to chance. Historically, this stock follows specific seasonal patterns that institutional traders use to maximize returns.
- ✅ Identify the "Golden Buying Window"
- ✅ Avoid high-risk correction cycles
- ✅ Backtested data from the last 20+ years