June 02, 2025 a 07:31 am

QCOM: Dividend Analysis - QUALCOMM Incorporated
QUALCOMM Incorporated presents a compelling proposition for dividend-focused investors, with its long-standing history of dividend payments underscored by moderate growth rates. With a consistent dividend history over the past 24 years and robust payout ratios, QCOM stands out as a reliable income asset. While the current dividend yield stands at approximately 2.37%, investors are encouraged by its potential for continued growth in a volatile market. This analysis will delve into various financial metrics to evaluate the attractiveness of QCOM’s dividend profile comprehensively.
📊 Overview
| Metric | Value |
|---|---|
| Sector | Technology |
| Dividend Yield | 2.37% |
| Current Dividend per Share | $3.30 |
| Dividend History | 24 years |
| Last Cut or Suspension | None |
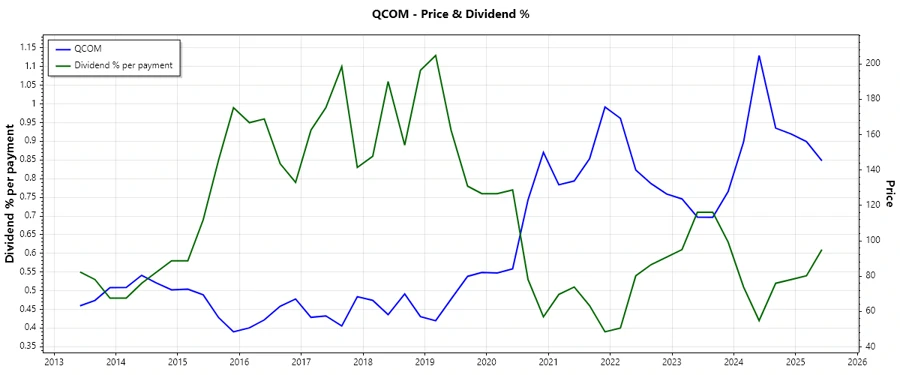
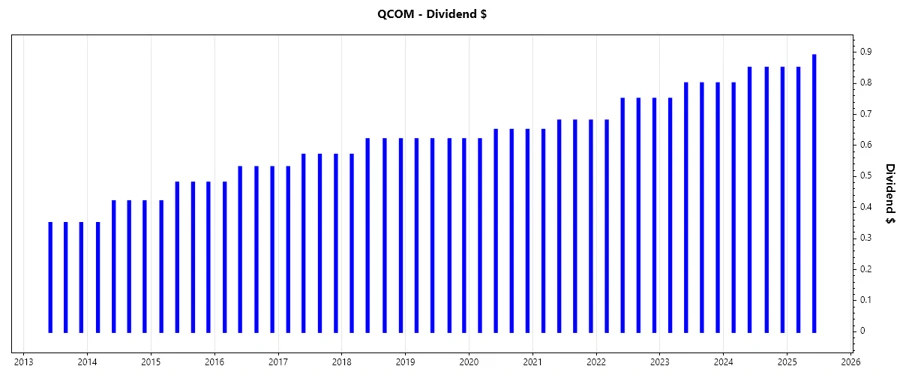
🗣️ Dividend History
QUALCOMM's impressive dividend history, spanning 24 years, reflects a strong commitment to rewarding shareholders and underscores the financial health of the company. Thorough knowledge of a firm's dividend past is critical, offering insights into management's prioritization of shareholder returns.
| Year | Dividend per Share (USD) |
|---|---|
| 2025 | 1.74 |
| 2024 | 3.35 |
| 2023 | 3.15 |
| 2022 | 2.93 |
| 2021 | 2.69 |
📈 Dividend Growth
Evaluating the growth of dividends over time reveals the potential for increased shareholder returns. With a moderate dividend growth rate over the last three and five years, QUALCOMM showcases its ability to augment payouts sustainably.
| Time | Growth |
|---|---|
| 3 years | 7.59% |
| 5 years | 6.20% |
The average dividend growth is 6.20% over 5 years. This shows moderate but steady dividend growth.
⚖️ Payout Ratio
Analyzing the payout ratio is crucial to assessing dividend sustainability. QUALCOMM demonstrates a prudent approach to balancing earnings distributions to shareholders with future growth requirements, maintaining healthy EPS and cash flow-based payout ratios.
| Key Figure | Ratio |
|---|---|
| EPS-based | 33.03% |
| Free cash flow-based | 30.99% |
A payout ratio of 33.03% based on EPS and 30.99% on FCF indicates room for possible dividend increases while respecting the company's capital allocation priorities.
💰 Cashflow & Capital Efficiency
The firm's cash flow statements and capital efficiency metrics are vital in understanding its capacity to sustain and grow dividends. Key insights include its free cash flow yield and efficient allocation of capital expenditures relative to operating cash flow.
| Year | 2024 | 2023 | 2022 |
|---|---|---|---|
| Free Cash Flow Yield | 5.88% | 7.98% | 5.08% |
| Earnings Yield | 5.34% | 5.86% | 9.62% |
| CAPEX to Operating Cash Flow | 8.53% | 12.83% | 24.87% |
| Stock-based Compensation to Revenue | 6.80% | 6.93% | 4.60% |
| Free Cash Flow / Operating Cash Flow Ratio | 91.47% | 87.17% | 75.13% |
The data suggests strong cash flow management and efficient resource allocation, contributing positively to the firm's ability to maintain and potentially increase dividend payments.
📉 Balance Sheet & Leverage Analysis
Qualcomm's balance sheet and leverage metrics highlight a mix of high liquidity and manageable debt levels, showcasing financial stability that supports enduring dividend payouts and growth.
| Year | 2024 | 2023 | 2022 |
|---|---|---|---|
| Debt-to-Equity | 0.56 | 0.71 | 0.86 |
| Debt-to-Assets | 0.27 | 0.30 | 0.32 |
| Debt-to-Capital | 0.36 | 0.42 | 0.46 |
| Net Debt to EBITDA | 0.53 | 0.66 | 0.77 |
| Current Ratio | 2.40 | 2.33 | 1.75 |
| Quick Ratio | 1.79 | 1.67 | 1.21 |
| Financial Leverage | 2.10 | 2.37 | 2.72 |
The balance sheet analysis reveals healthy metrics with room for leveraging if needed, affirming QUALCOMM's financial stability and its capability to support sustainable dividend practices.
🏢 Fundamental Strength & Profitability
Qualcomm's profitability and fundamental strength further emphasize its robust operational performance, with particular strengths evident in return metrics and gross margins, contributing positively to sustainable shareholder yield.
| Year | 2024 | 2023 | 2022 |
|---|---|---|---|
| Return on Equity | 38.60% | 33.51% | 71.81% |
| Return on Assets | 18.39% | 14.17% | 26.39% |
| Margins: Net | 26.03% | 20.19% | 29.27% |
| Margins: EBIT | 28.32% | 22.72% | 35.04% |
| Margins: EBITDA | 32.70% | 29.20% | 37.47% |
| Margins: Gross | 56.21% | 55.70% | 57.84% |
| R&D to Revenue | 21.30% | 24.62% | 18.54% |
The company's fundamental and profitability metrics underline a strong business model and efficient management, bolstering potential for continued dividend payments.
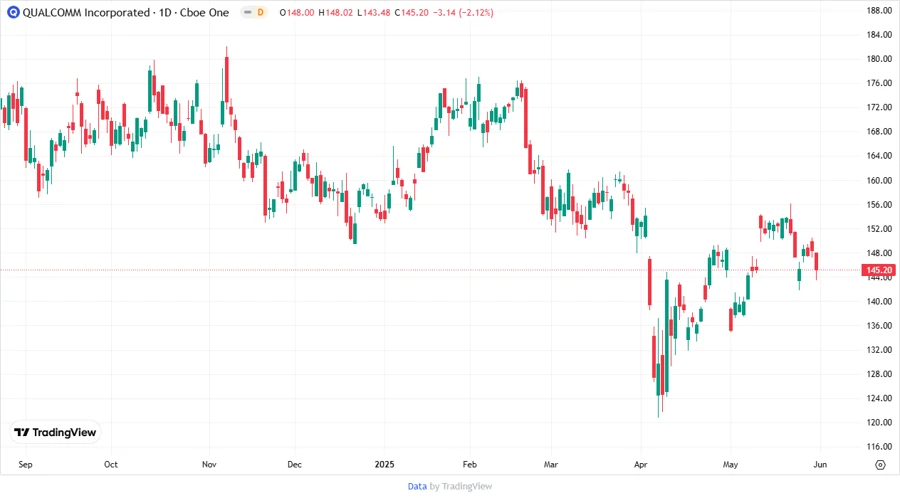
📈 Price Development
✅ Dividend Scoring System
| Criterion | Description | Score |
|---|---|---|
| Dividend yield | Appropriate yield for sector | |
| Dividend Stability | Consistent payments | |
| Dividend growth | Moderate growth trajectory | |
| Payout ratio | Safe payout levels | |
| Financial stability | Strong balance sheet | |
| Dividend continuity | No past cuts | |
| Cashflow Coverage | Solid cash flow backing | |
| Balance Sheet Quality | Great leverage ratios |
Total Score: 32.25/40
💡 Rating
In summary, QUALCOMM Incorporated offers a compelling option for income-focused investors, noted for its robust dividend history, steady growth potential, safe payout ratios, and solid financial health. With a total score of 32.25 out of 40, QCOM is recommended for investors seeking stable dividend yields with moderate capital appreciation potential.
Smart Data Insight
Master the Perfect Entry & Exit for this Stock
Don't leave your profits to chance. Historically, this stock follows specific seasonal patterns that institutional traders use to maximize returns.
- ✅ Identify the "Golden Buying Window"
- ✅ Avoid high-risk correction cycles
- ✅ Backtested data from the last 20+ years