July 03, 2026 a 02:03 pm


PYPL: Trend and Support & Resistance Analysis - PayPal Holdings, Inc.
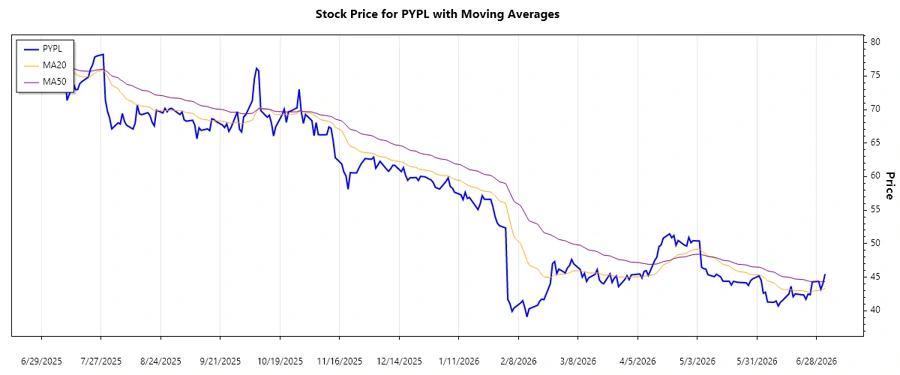
PayPal Holdings, Inc. offers a robust financial ecosystem that caters to digital transactions globally. With a variety of services under its belt, like PayPal, Venmo, and Braintree, it has become a key facilitator in digital payments. Recently, PayPal's stock has shown a fluctuating trend and actively trades within critical support and resistance zones, highlighting the potential for both risks and growth opportunities for investors.
Trend Analysis
By computing the EMA20 and EMA50 from the closing prices, we can observe significant trend directions. Over the last few weeks, the price movement indicates a dominance of downward trends, suggesting bearish sentiment among traders.
| Date | Closing Price | Trend |
|---|---|---|
| 2026-07-02 | 45.47 | ▼ |
| 2026-07-01 | 44.07 | ▼ |
| 2026-06-30 | 43.18 | ▼ |
| 2026-06-29 | 44.38 | ▲ |
| 2026-06-26 | 44.29 | ⚖️ |
| 2026-06-25 | 42.38 | ▼ |
| 2026-06-24 | 42.48 | ▲ |
Conclusively, the data suggests a consistent bearish sentiment; nevertheless, short-term bullish corrections are present.
Support- and Resistance
The following analysis identifies key support and resistance zones. PayPal's current market price often interacts with these crucial levels, indicating strong zones of buyer or seller interests.
| Zone Type | From | To |
|---|---|---|
| Support 1 | 41.00 | 42.00 |
| Support 2 | 44.00 | 45.00 |
| Resistance 1 | 46.00 | 47.00 |
| Resistance 2 | 48.00 | 49.00 |
Currently, the stock seems confined within a minor support zone but shows potential to test higher resistance levels with increasing volumes.
Conclusion
While PayPal's recent price action suggests a bearish tilt, the strong framework of support and resistance levels provides potential opportunities for traders to capitalize on reversal patterns or breakouts. Analysts should closely monitor trading volumes and additional external economic factors. Given PayPal's influential role in the digital payment ecosystem, market advancements could provide robustness against downward trends. However, continued bearish pressure could also steer prices towards lower support zones, necessitating a cautious approach.
Smart Data Insight
Master the Perfect Entry & Exit for this Stock
Don't leave your profits to chance. Historically, this stock follows specific seasonal patterns that institutional traders use to maximize returns.
- ✅ Identify the "Golden Buying Window"
- ✅ Avoid high-risk correction cycles
- ✅ Backtested data from the last 20+ years