January 19, 2026 a 01:15 pm

PYPL: Trend and Support & Resistance Analysis - PayPal Holdings, Inc.
PayPal Holdings, Inc., known for empowering digital payments worldwide, has faced recent fluctuations in its stock prices. The company's broad payment solutions portfolio still provides a robust market presence. However, with market dynamics continually shifting, understanding its stock trends is crucial for making informed investment decisions.
Trend Analysis
| Date | Closing Price | Trend |
|---|---|---|
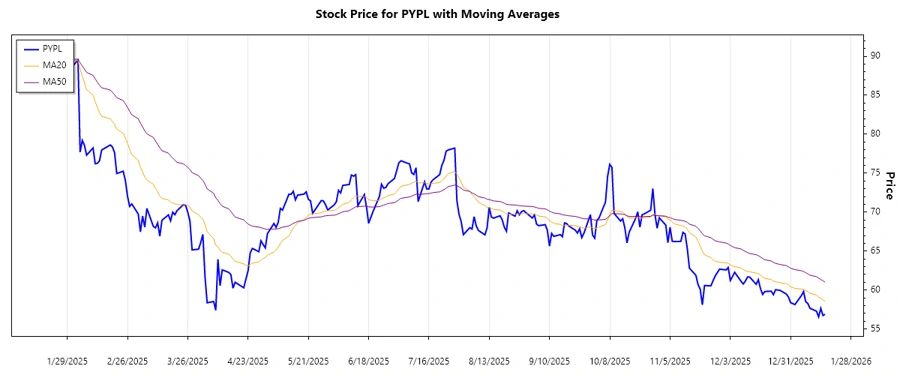
| 2026-01-16 | 56.89 | ▼ |
| 2026-01-15 | 56.74 | ▼ |
| 2026-01-14 | 57.66 | ▼ |
| 2026-01-13 | 56.56 | ▼ |
| 2026-01-12 | 57.29 | ▼ |
| 2026-01-09 | 57.66 | ▼ |
| 2026-01-08 | 58.27 | ▼ |
The calculated EMA20 is below the EMA50, indicating a prevailing downtrend (▼) in recent weeks.
Support and Resistance Analysis
| Zone Type | From | To | Direction |
|---|---|---|---|
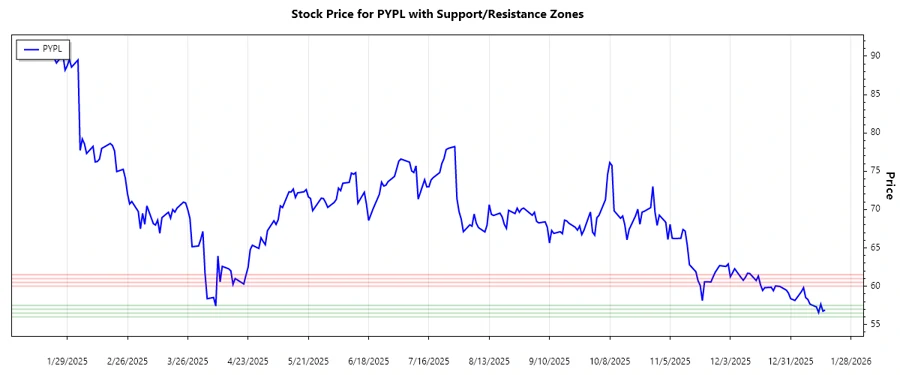
| Support Zone 1 | 56.00 | 56.50 | ▲ |
| Support Zone 2 | 57.00 | 57.50 | ▲ |
| Resistance Zone 1 | 60.00 | 60.50 | ▼ |
| Resistance Zone 2 | 61.00 | 61.50 | ▼ |
The current price of PYPL is within the lower support zone, suggesting possible price stabilization or a bounce upwards.
Conclusion
The analysis shows that PayPal Holdings, Inc. is presently in a downtrend, as evidenced by the stock closing prices and moving averages. The stock has recently tested critical support zones, indicating possible stabilization. While the broader market conditions influence PYPL, technical indicators suggest vigilance for potential trend reversals. Investors are advised to consider these insights, alongside macroeconomic factors, when making decisions regarding PYPL. Continuous monitoring of both support and resistance zones will be crucial for forecasting directional movements in the near term.