November 20, 2025 a 11:44 am

PYPL: Fibonacci Analysis - PayPal Holdings, Inc.
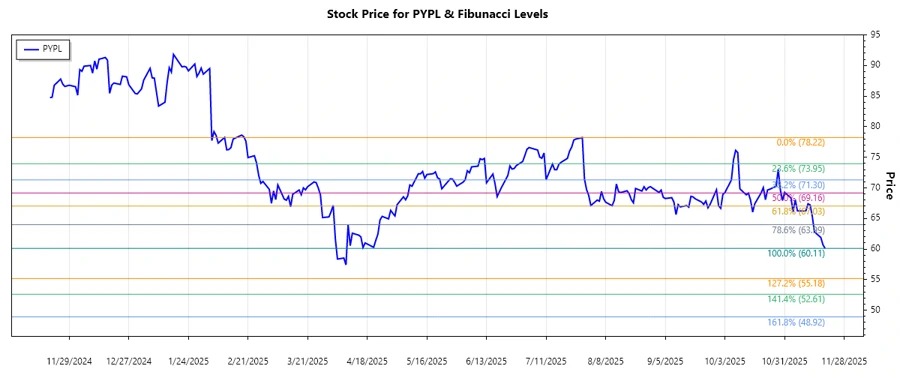
PayPal Holdings, Inc. has seen significant fluctuations in its stock over recent months. While the company has a strong foothold in the digital payment industry, the stock faces challenges from increasing competition and regulatory changes. Investors should watch for signs of stabilization in its key markets. The technical setup, as revealed by our Fibonacci analysis, provides critical insight into potential support and resistance levels.
Fibonacci Analysis
| Detail | Information | ||||||||||||
|---|---|---|---|---|---|---|---|---|---|---|---|---|---|
| Start Date | 2025-07-28 | ||||||||||||
| End Date | 2025-11-19 | ||||||||||||
| High Price | $78.22 on 2025-07-28 | ||||||||||||
| Low Price | $60.11 on 2025-11-19 | ||||||||||||
| Fibonacci Levels |
|
||||||||||||
| Current Price Position | The current price of $60.11 is below the Fibonacci levels, indicating no retracement. | ||||||||||||
| Technical Interpretation | The Fibonacci levels indicate potential resistance areas; however, a breach below suggests bearish continuation without immediate support. |
Conclusion
PayPal's stock has experienced a dominant downtrend from late July to mid-November, reflecting broader challenges in the global payments marketplace. Despite its established network, regulatory pressures and market saturation are potential risks. This technical analysis suggests that the stock remains under selling pressure, likely requiring a catalyst for a meaningful reversal. However, with its robust platform and diverse offerings, PayPal can capitalize on future growth opportunities if it overcomes short-term obstacles.