
September 24, 2025 a 05:15 am
PYPL: Fibonacci Analysis - PayPal Holdings, Inc.
PayPal Holdings, Inc. has shown varied performance over the past months. As a leader in digital payments, the stock has experienced fluctuations influenced by market trends and consumer behavior. Evaluating its recent activity reveals pivotal insights into its future trajectory.
Fibonacci Analysis
| Trend | Start Date | End Date | High (Date) | Low (Date) |
|---|---|---|---|---|
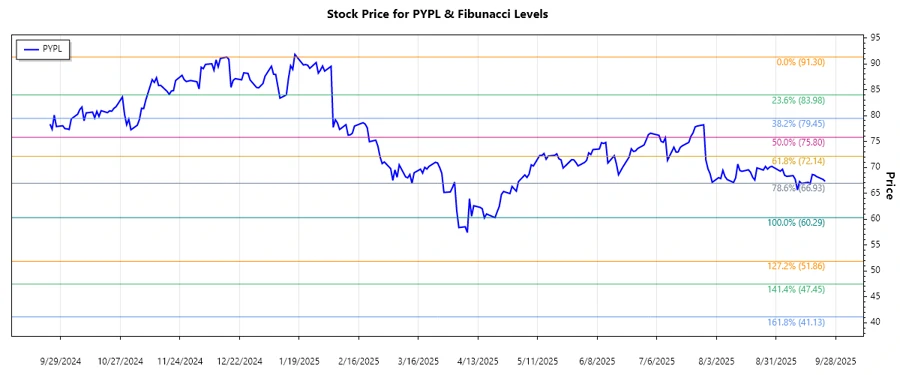
| Down | 2024-12-17 | 2025-09-23 | $91.30 (2024-12-16) | $60.29 (2025-04-21) |
Fibonacci Retracement Levels
| Level | Price |
|---|---|
| 0.236 | $67.35 |
| 0.382 | $72.72 |
| 0.5 | $75.79 |
| 0.618 | $78.86 |
| 0.786 | $83.16 |
The current price is $67.31, which is in the 0.236 retracement zone. This level could act as a potential resistance. If broken, the price might test higher levels.
Conclusion
The PayPal stock has shown a downward trend from a high of $91.30 to a low of $60.29 in recent months. Current analysis indicates the stock is within a minor retracement level, offering opportunities for both support and potential recovery. Analysts should be aware of external market influences affecting consumer behavior with digital payments, as these could impact future valuations and trend directions.
Smart Data Insight
Master the Perfect Entry & Exit for this Stock
Don't leave your profits to chance. Historically, this stock follows specific seasonal patterns that institutional traders use to maximize returns.
- ✅ Identify the "Golden Buying Window"
- ✅ Avoid high-risk correction cycles
- ✅ Backtested data from the last 20+ years