September 13, 2025 a 04:45 pm

PYPL: Fibonacci Analysis - PayPal Holdings, Inc.
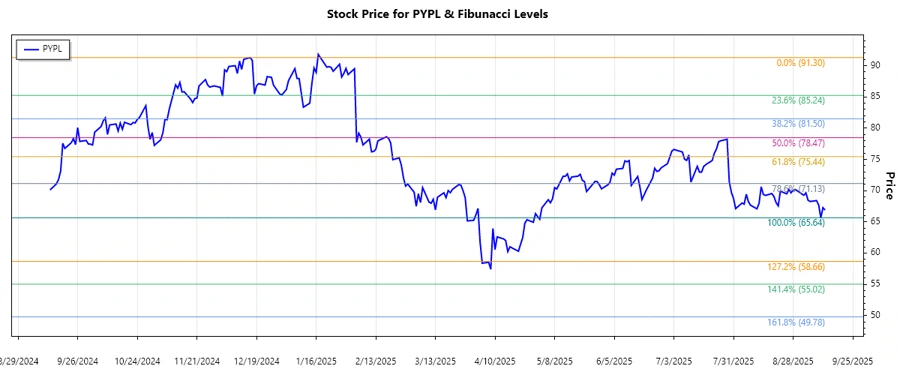
PayPal Holdings, Inc. has been experiencing a downward trend over the analyzed period. Despite its robust platform, recent months have shown a decline in investor confidence, leading to pressure on the stock price. The technical indicators point towards potential support within the Fibonacci retracement levels. Astute investors will need to consider both the fundamental strength of PayPal's business and the technical signals before making informed decisions.
Fibonacci Analysis
| Metric | Details |
|---|---|
| Trend Start Date | 2024-12-17 |
| Trend End Date | 2025-09-12 |
| High Price | $91.30 on 2024-12-16 |
| Low Price | $65.64 on 2025-09-10 |
| Current Price | $66.89 |
| Fibonacci Levels |
|
| Retracement Zone | Currently not in a retracement zone |
| Technical Interpretation | The stock is hovering near its recent lows. There may be potential support at the $69.713 level if the price begins to revert. Close monitoring for a potential reversal or breakdown is warranted. |
Conclusion
The downward trend observed in PayPal's stock may reflect broader market sentiment and competitive pressures. In the coming weeks, the ability to stay above critical support levels, such as those identified in our Fibonacci analysis, will be crucial. Risks include continued market uncertainty and evolving payment landscapes, whereas opportunities lie in PayPal's market penetration and innovation. Analysts should consider both the potential for a rebound given solid fundamentals and downside risks due to prevailing trends.