April 06, 2026 a 03:31 pm
PWR: Dividend Analysis - Quanta Services, Inc.
Quanta Services, Inc. presents as a moderately yielding dividend stock with a diversified operational base. Its stable dividend history and future growth prospects make it an attractive option for dividend-focused investors seeking consistent income. Moreover, the company's disciplined management of payout ratios signifies a sustainable dividend policy with potential for growth.
Overview 📊
Quanta Services, Inc., operating in the Industrial Sector, exhibits a low dividend yield of 0.07%. The company's current dividend per share stands at approximately $0.40, with a continuous dividend history stretching over 9 years. There have been no recent cuts or suspensions, reflecting a stable dividend policy.
| Sector | Dividend Yield | Current Dividend Per Share | Dividend History | Last Cut or Suspension |
|---|---|---|---|---|
| Industrial | 0.07% | $0.40 USD | 9 years | None |
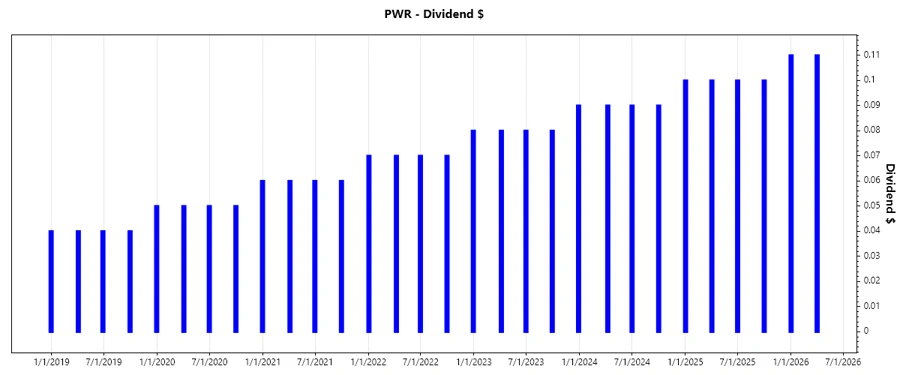
Dividend History 📉
The consistency in the dividend payments over the years is indicative of Quanta Services' financial robustness and its commitment to shareholder returns. Examining historical payouts aids in understanding the company's past financial health and reliability.
| Year | Dividend Per Share (USD) |
|---|---|
| 2026 | 0.22 |
| 2025 | 0.40 |
| 2024 | 0.27 |
| 2023 | 0.33 |
| 2022 | 0.36 |
Dividend Growth 📈
Examining the dividend growth provides insights into future expectations of dividend income and the company's ability to increase its payouts. Over the last three years, the dividend growth rate was approximately 3.57%, while for the five-year period, it reached 13.75%, suggesting a moderate but upward trend.
| Time | Growth |
|---|---|
| 3 years | 3.57% |
| 5 years | 13.75% |
The average dividend growth is 13.75% over 5 years. This shows moderate but steady dividend growth.
Payout Ratio ✅
The payout ratios are crucial indicators of how much earnings and cash flow are being returned to shareholders in the form of dividends. A lower ratio signifies a cushion for the company to maintain dividend payments during periods of financial instability.
| Key Figure | Ratio |
|---|---|
| EPS-based | 5.87% |
| Free cash flow-based | 3.68% |
The EPS payout ratio of 5.87% and a free cash flow payout ratio of 3.68% indicate a disciplined approach, allowing capacity for reinvestment into the company.
Cashflow & Capital Efficiency
The cash flow and capital efficiency metrics highlight the company's jurisdiction in generating free cash flow and deploying capital effectively. These metrics are integral to evaluating financial health and operational efficacy.
| Year | 2023 | 2024 | 2025 |
|---|---|---|---|
| Free Cash Flow Yield | 3.64% | 3.18% | 2.53% |
| Earnings Yield | 2.38% | 1.95% | 1.61% |
| CAPEX to Operating Cash Flow | 27.59% | 29.03% | 27.32% |
| Stock-based Compensation to Revenue | 0.61% | 0.64% | 0.64% |
| Free Cash Flow/Operating Cash Flow Ratio | 72.41% | 70.97% | 72.68% |
The company's cash flow ratios suggest effective capital management, with a consistent free cash flow generation supporting its financial obligations.
Balance Sheet & Leverage Analysis
Understanding leverage and balance sheet health is crucial for assessing financial flexibility and insolvency risk. An optimal leverage allows for strategic expansion while minimizing financial distress.
| Year | 2023 | 2024 | 2025 |
|---|---|---|---|
| Debt-to-Equity | 71.17% | 61.21% | 13.29% |
| Debt-to-Assets | 27.49% | 23.97% | 4.77% |
| Debt-to-Capital | 41.58% | 37.97% | 11.73% |
| Net Debt to EBITDA | 1.79 | 1.73 | 0.30 |
| Current Ratio | 1.47 | 1.30 | 1.14 |
| Quick Ratio | 1.44 | 1.26 | 1.09 |
| Financial Leverage | 2.59 | 2.55 | 2.79 |
The debt-to-equity and net debt to EBITDA ratios suggest a well-managed debt structure, providing both operational leverage and liquidity.
Fundamental Strength & Profitability 🗣️
Profitability ratios, such as Return on Equity (ROE), offer crucial insights into how effectively the company generates profit from shareholders' equity. High profitability implies better returns for investors.
| Year | 2023 | 2024 | 2025 |
|---|---|---|---|
| Return on Equity | 11.87% | 12.36% | 11.51% |
| Return on Assets | 4.59% | 4.84% | 4.13% |
| Net Margin | 3.57% | 3.82% | 3.63% |
| EBIT Margin | 5.54% | 5.98% | 5.90% |
| EBITDA Margin | 8.48% | 9.11% | 8.88% |
| Gross Margin | 12.68% | 13.21% | 13.03% |
| Research & Development to Revenue | 0.00% | 0.00% | 0.00% |
The company displays solid profitability margins, although there's room for improvement in its overall margin expansion strategies.
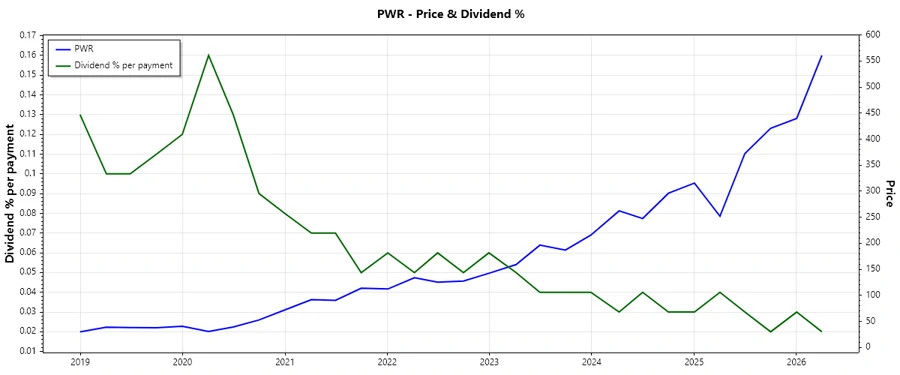
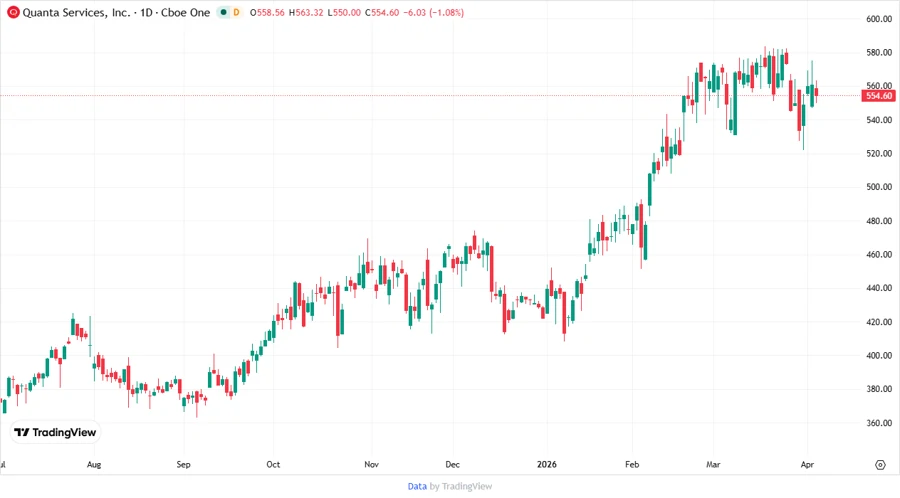
Price Development 🟢
Dividend Scoring System 💯
| Criteria | Score | |
|---|---|---|
| Dividend Yield | 2 | |
| Dividend Stability | 4 | |
| Dividend Growth | 3 | |
| Payout Ratio | 5 | |
| Financial Stability | 4 | |
| Dividend Continuity | 4 | |
| Cashflow Coverage | 4 | |
| Balance Sheet Quality | 3 |
Total Score: 29 out of 40
Rating 🏆
Quanta Services, Inc. demonstrates a reliable dividend profile backed by moderate growth prospects and a consistent payout history. With prudent financial management and an emphasis on shareholder returns, it suits investors aiming for steady income generation with moderate growth potential. Recommended as a Buy for dividend-focused portfolios.
Smart Data Insight
Master the Perfect Entry & Exit for this Stock
Don't leave your profits to chance. Historically, this stock follows specific seasonal patterns that institutional traders use to maximize returns.
- ✅ Identify the "Golden Buying Window"
- ✅ Avoid high-risk correction cycles
- ✅ Backtested data from the last 20+ years