
July 01, 2026 a 09:03 am
PTC: Trend and Support & Resistance Analysis - PTC Inc.
PTC Inc. operates in the technological sector providing crucial software solutions that facilitate digital transformation across various industries. The recent data indicate a prevailing downtrend in the stock's performance, with potential long-term opportunities for investors who are cautious about risk. With a comprehensive suite of offerings in areas like augmented reality and cloud-based product development, the firm's future growth is promising but currently overshadowed by market corrections.
Trend Analysis
| Date | Closing Price | Trend |
|---|---|---|
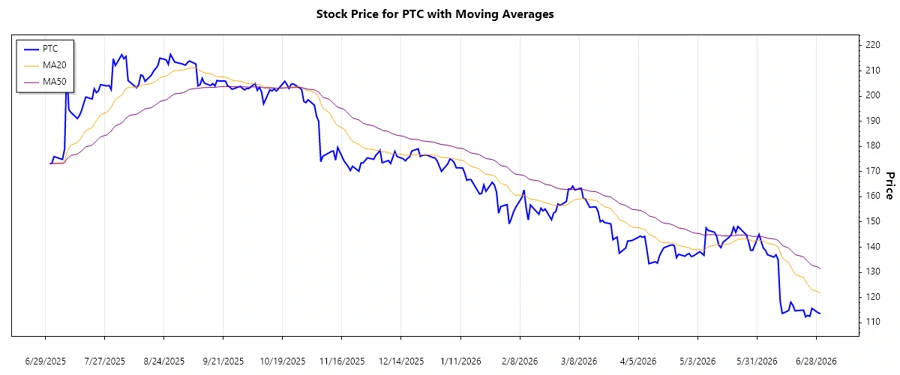
| 2026-06-30 | 113.61 | ▼ |
| 2026-06-29 | 113.89 | ▼ |
| 2026-06-26 | 115.72 | ▼ |
| 2026-06-25 | 112.55 | ▼ |
| 2026-06-24 | 112.93 | ▼ |
| 2026-06-23 | 112.33 | ▼ |
| 2026-06-22 | 115.00 | ▼ |
The short-term analysis indicates a consistent downward trend as the EMA20 is below the EMA50. This suggests a continuation of bearish sentiments.
Support and Resistance
| Zone | From | To |
|---|---|---|
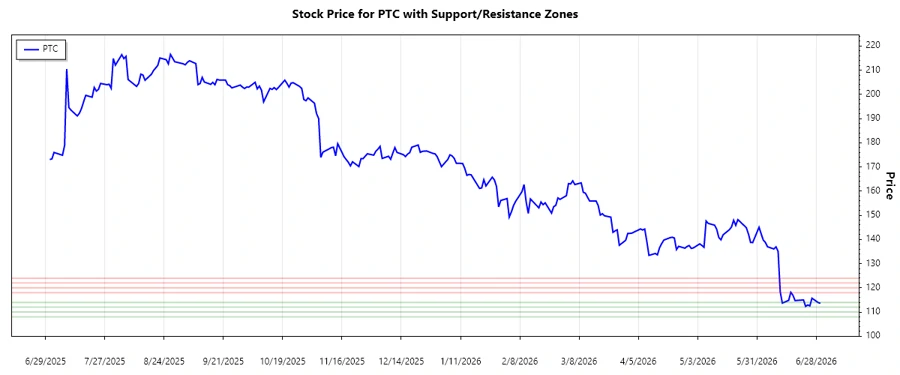
| Support 1 | 112.00 | 114.00 |
| Support 2 | 108.00 | 110.00 |
| Resistance 1 | 118.00 | 120.00 |
| Resistance 2 | 122.00 | 124.00 |
Currently, the stock price is within the first support zone, indicating a potential area for consolidation or reversal.
Conclusion
The analysis reveals that PTC Inc.'s stock is undergoing a bearish phase with clear downward momentum. Despite the short-term challenges, the wide range of innovative products and strategic market presence underpin a fundamentally strong business. Investors should be cautious and watch for shifts in market sentiment and potential reversals. Support levels could provide buying opportunities while resistance zones warn of selling pressure. Overall, while the current outlook is cautious, PTC remains a potential candidate for long-term growth given its robust technological offerings.
Smart Data Insight
Master the Perfect Entry & Exit for this Stock
Don't leave your profits to chance. Historically, this stock follows specific seasonal patterns that institutional traders use to maximize returns.
- ✅ Identify the "Golden Buying Window"
- ✅ Avoid high-risk correction cycles
- ✅ Backtested data from the last 20+ years