
July 02, 2026 a 08:15 am

PSX: Trend and Support & Resistance Analysis - Phillips 66
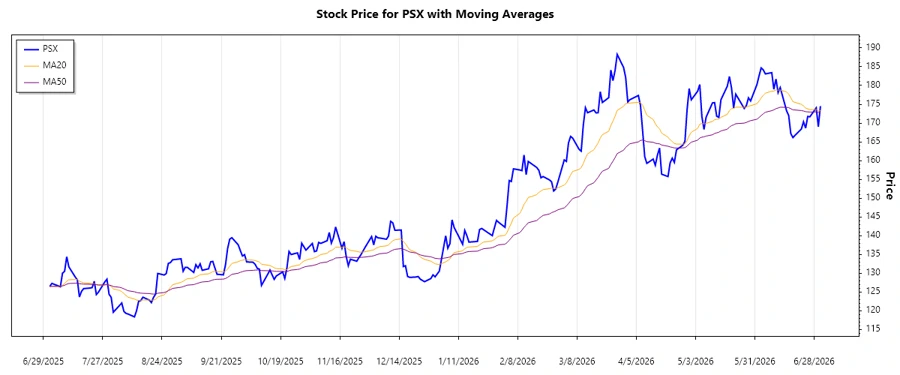
Phillips 66, a diversified energy company, has shown significant volatility in its stock price over the past few months. The analysis of recent pricing trends indicates a mix of both upward and downward pressures, influenced by market dynamics in the energy sector. Investors should note that the technical indicators reveal potential opportunities but also highlight inherent risks due to market fluctuations. A closer look at support and resistance zones, alongside EMA analysis, provides further insight into potential stock movements.
Trend Analysis
The recent analysis based on daily closing prices and moving averages suggests a nuanced trend for Phillips 66. The Exponential Moving Average (EMA) is calculated over the short (20-day) and long term (50-day) to provide a clearer picture of the prevailing market sentiment.
| Date | Closing Price | Trend |
|---|---|---|
| 2026-07-01 | $174.5 | ⚖️ |
| 2026-06-30 | $169.05 | ⚖️ |
| 2026-06-29 | $174.05 | ⚖️ |
| 2026-06-26 | $171.65 | ⚖️ |
| 2026-06-25 | $171.76 | ⚖️ |
| 2026-06-24 | $168.64 | ⚖️ |
| 2026-06-23 | $170.34 | ⚖️ |
The calculated EMAs indicate a leveling of trends, suggesting possible consolidation. Given the market conditions, investors should monitor for potential breakouts or further consolidation.
Support and Resistance
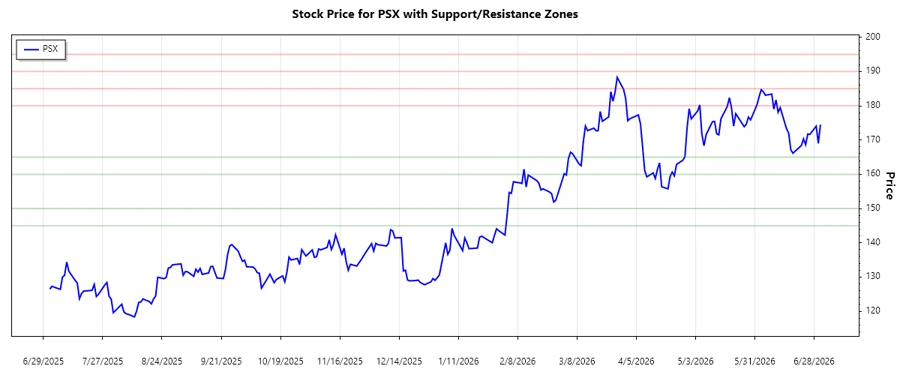
Support and resistance levels are crucial for determining potential price movements and investor sentiment. Based on the given dataset, the following zones have been identified:
| Zone Type | From | To |
|---|---|---|
| Support 1 | $160.00 | $165.00 |
| Support 2 | $145.00 | $150.00 |
| Resistance 1 | $180.00 | $185.00 |
| Resistance 2 | $190.00 | $195.00 |
The current price is hovering close to the first resistance level, indicating potential pressure points for upward resistance. This highlights an area for strategic entry or exits based on investor strategy.
Conclusion
The Phillips 66 stock demonstrates a balanced market position with potential volatility indicated by key technical indicators. Recent price movements suggest proximity to resistance zones, demanding careful observation from market participants. Crucially, while there is potential for growth, external factors such as energy market changes could introduce risks. Hence, analysts are advised to maintain a disciplined approach, incorporating fundamental insights alongside technical analysis for optimized decision-making.
Smart Data Insight
Master the Perfect Entry & Exit for this Stock
Don't leave your profits to chance. Historically, this stock follows specific seasonal patterns that institutional traders use to maximize returns.
- ✅ Identify the "Golden Buying Window"
- ✅ Avoid high-risk correction cycles
- ✅ Backtested data from the last 20+ years