June 04, 2026 a 01:15 pm

PSX: Trend and Support & Resistance Analysis - Phillips 66
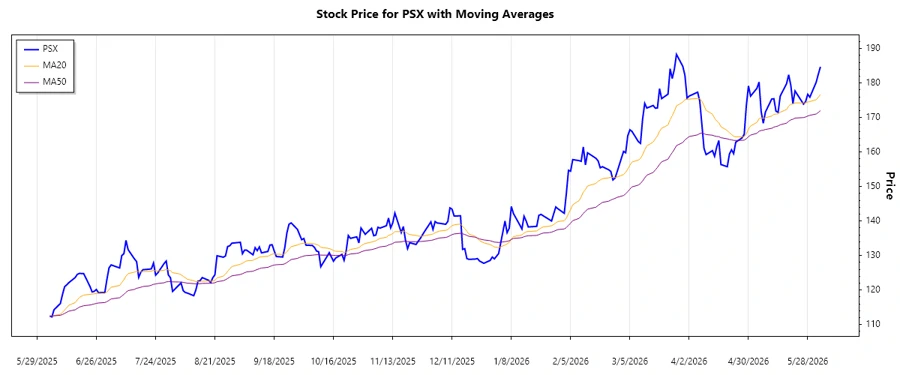
The Phillips 66 stock showed significant fluctuations in recent months attributed to dynamic market conditions and sector-related developments. As a key player in energy manufacturing and logistics, the company is well-positioned within its industry, although it must navigate volatility in crude oil prices and regulatory changes. The technical analysis below provides insights into the recent trend patterns, support, and resistance levels, which could help investors make informed decisions about their positions in PSX.
Trend Analysis
| Date | Closing Price | Trend |
|---|---|---|
| June 3, 2026 | 184.68 | ▲ Uptrend |
| June 2, 2026 | 182.56 | ▲ Uptrend |
| June 1, 2026 | 180.24 | ▲ Uptrend |
| May 29, 2026 | 175.88 | ▲ Uptrend |
| May 28, 2026 | 176.71 | ▲ Uptrend |
| May 27, 2026 | 174.63 | ▲ Uptrend |
| May 26, 2026 | 173.88 | ▲ Uptrend |
The trend analysis indicates a consistent uptrend with the EMA20 consistently above the EMA50. This signifies a bullish sentiment among investors, suggesting continued upward momentum.
Support and Resistance
| Zone Type | From | To |
|---|---|---|
| Support 1 | 174.00 | 175.00 |
| Support 2 | 169.00 | 170.00 |
| Resistance 1 | 180.00 | 182.00 |
| Resistance 2 | 183.00 | 185.00 |
The Phillips 66 stock is currently trading near its first resistance zone, signaling a potential barrier where supply might start exceeding demand, slowing further growth. Monitoring how the stock reacts to this level is important for the continuation of the trend.
Conclusion
The Phillips 66 stock is showing promising signs, with a notable uptrend that may attract bullish investors. The current trading positions near a resistance level require careful attention, as a breakout could lead to higher targets. However, the already realized extensive gains imply an increased risk of corrections. Monitoring both internal company developments and external market trends will be pivotal in guiding future projections. Investors should also keep an eye on any shifts in energy policies that might significantly impact the company’s fundamentals.
Smart Data Insight
Master the Perfect Entry & Exit for this Stock
Don't leave your profits to chance. Historically, this stock follows specific seasonal patterns that institutional traders use to maximize returns.
- ✅ Identify the "Golden Buying Window"
- ✅ Avoid high-risk correction cycles
- ✅ Backtested data from the last 20+ years