August 21, 2025 a 03:16 am**PSX: Trend and Support & Resistance Analysis - Phillips 66**
 **Trend Analysis**
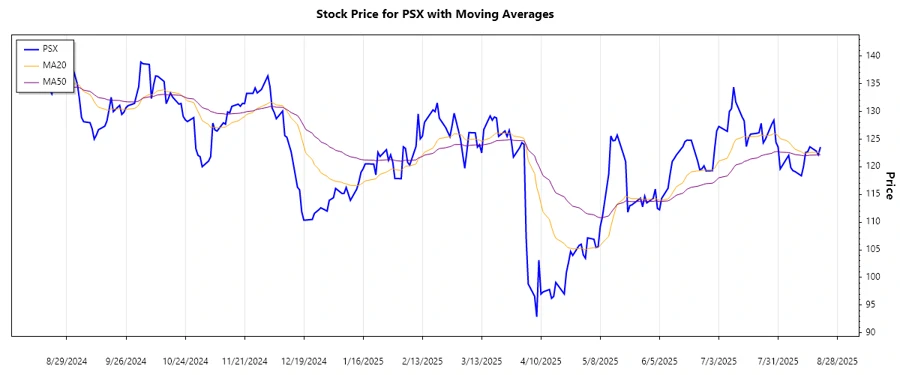
Phillips 66's recent price behavior reveals an intricate pattern of uptrends and downtrends. Calculating the Exponential Moving Averages (EMA) provides insights into these trends:
- EMA20: 123.62
- EMA50: 123.98
Currently, EMA20 < EMA50, indicating a ▼ downtrend. Below is the trend analysis table for the last 7 days:
**Trend Analysis**
Phillips 66's recent price behavior reveals an intricate pattern of uptrends and downtrends. Calculating the Exponential Moving Averages (EMA) provides insights into these trends:
- EMA20: 123.62
- EMA50: 123.98
Currently, EMA20 < EMA50, indicating a ▼ downtrend. Below is the trend analysis table for the last 7 days:
The prevailing downtrend suggests caution to short-term investors while long-term investors might view this as a potential buying opportunity at lower prices.
 **Support and Resistance**
Based on recent price levels, critical support and resistance zones have emerged:
Support Zones:
- 120.04 to 122.17
- 118.37 to 120.04
Resistance Zones:
- 123.57 to 125.00
- 126.00 to 127.00
**Support and Resistance**
Based on recent price levels, critical support and resistance zones have emerged:
Support Zones:
- 120.04 to 122.17
- 118.37 to 120.04
Resistance Zones:
- 123.57 to 125.00
- 126.00 to 127.00
Currently, the price is close to the first support zone, suggesting a potential entry point for investors. However, the impending resistance indicates that upward movements might be limited unless volumes increase.
 **Conclusion**
Phillips 66’s market position remains influenced by both current hydrocarbon demand challenges and alternative energy dynamics. The stock experiences a technical downtrend presently, yet consistently revisiting its defined support zones implies a significant foundation that could prospectively lead to capitalization once external market pressures alleviate. Analysts would need to assess both microeconomic and macroeconomic factors, ensuring that they are positioned strategically amidst what could be volatile market conditions. Potential investors should remain circumspect about these zones as price movements in the current trend must be evaluated within the broader context of the energy sector’s evolution.
**Conclusion**
Phillips 66’s market position remains influenced by both current hydrocarbon demand challenges and alternative energy dynamics. The stock experiences a technical downtrend presently, yet consistently revisiting its defined support zones implies a significant foundation that could prospectively lead to capitalization once external market pressures alleviate. Analysts would need to assess both microeconomic and macroeconomic factors, ensuring that they are positioned strategically amidst what could be volatile market conditions. Potential investors should remain circumspect about these zones as price movements in the current trend must be evaluated within the broader context of the energy sector’s evolution.
Phillips 66, operating within the energy manufacturing and logistics segment, depicts a complex landscape of price variations and market influences. By examining its historical price data, we can infer pivotal trends and zones that assist in guiding investment strategies. Recently, the stock has showcased a series of fluctuations which are critical to comprehending future price movements.
| Date | Close Price | Trend |
|---|---|---|
| 2025-08-20 | 123.57 | ▼ |
| 2025-08-19 | 122.17 | ▼ |
| 2025-08-18 | 122.84 | ▼ |
| 2025-08-15 | 123.61 | ▲ |
| 2025-08-14 | 122.73 | ▼ |
| 2025-08-13 | 122.58 | ▼ |
| 2025-08-12 | 120.04 | ▼ |
**Support and Resistance**
Based on recent price levels, critical support and resistance zones have emerged:
Support Zones:
- 120.04 to 122.17
- 118.37 to 120.04
Resistance Zones:
- 123.57 to 125.00
- 126.00 to 127.00
| Zone | Price Range |
|---|---|
| Support Zone 1 | 120.04 - 122.17 ▼ |
| Support Zone 2 | 118.37 - 120.04 ▼ |
| Resistance Zone 1 | 123.57 - 125.00 ▲ |
| Resistance Zone 2 | 126.00 - 127.00 ▲ |
**Conclusion**
Phillips 66’s market position remains influenced by both current hydrocarbon demand challenges and alternative energy dynamics. The stock experiences a technical downtrend presently, yet consistently revisiting its defined support zones implies a significant foundation that could prospectively lead to capitalization once external market pressures alleviate. Analysts would need to assess both microeconomic and macroeconomic factors, ensuring that they are positioned strategically amidst what could be volatile market conditions. Potential investors should remain circumspect about these zones as price movements in the current trend must be evaluated within the broader context of the energy sector’s evolution.