June 13, 2026 a 06:00 pm

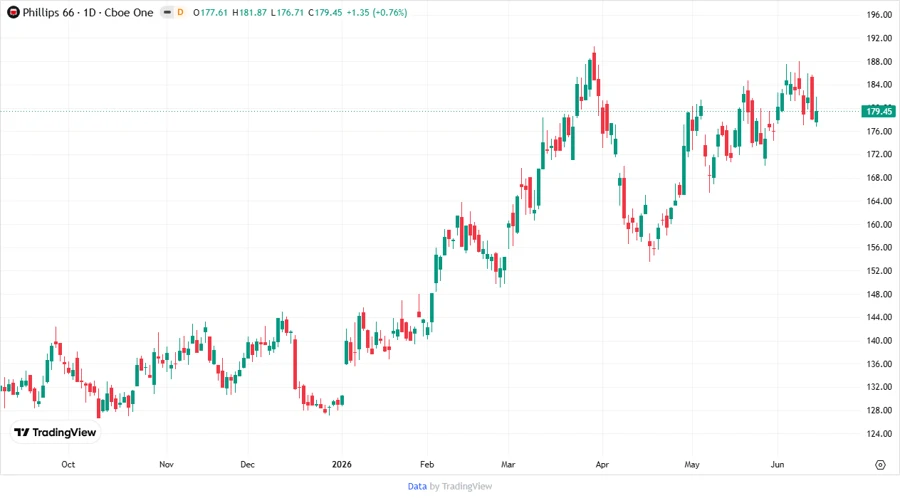
PSX: Fundamental Ratio Analysis - Phillips 66
Phillips 66, a dynamic player in the energy sector, continues to leverage its diversified business model to navigate market challenges. The company's strong focus on manufacturing and logistics positions it well for future growth, making it a compelling choice for investors seeking exposure to the oil & gas refining and marketing industry.
Fundamental Rating
The fundamental rating for Phillips 66 reflects a secure position within its sector. With diversified revenue streams and robust segment performances, the company is rated 'B'. Below are specific ratings across key financial metrics.
| Category | Rating | Score |
|---|---|---|
| Discounted Cash Flow | 3 | |
| Return on Equity | 4 | |
| Return on Assets | 4 | |
| Debt to Equity | 2 | |
| Price to Earnings | 2 | |
| Price to Book | 2 |
Historical Rating
Below is a comparison of Phillips 66's historical performance metrics. A stable scoring in recent times shows consistent financial health.
| Date | Overall | DCF | ROE | ROA | Debt/Equity | P/E | P/B |
|---|---|---|---|---|---|---|---|
| 2026-06-12 | 3 | 3 | 4 | 4 | 2 | 2 | 2 |
| N/A | 0 | 3 | 4 | 4 | 2 | 2 | 2 |
Analyst Price Targets
Analysts have set targets reflecting the potential upside in price, with the consensus aimed at encouraging investment. The range from low to high suggests market variability but general optimism.
| High | Low | Median | Consensus |
|---|---|---|---|
| $212 | $140 | $172 | $176.67 |
Analyst Sentiment
The sentiment among analysts is largely positive, with the majority expressing 'Buy' ratings. This demonstrates confidence in Phillips 66's strategic direction and financial stability.
| Recommendation | Count | Distribution |
|---|---|---|
| Strong Buy | 0 | |
| Buy | 20 | |
| Hold | 13 | |
| Sell | 2 | |
| Strong Sell | 0 |
Conclusion
Phillips 66 exhibits a balanced mix of stability and growth potential, making it an attractive investment candidate. While it faces typical industry challenges, its diversified operations and strong market positioning provide resilience. Investors can expect consistent returns bolstered by strategic investments in key segments. However, fluctuations in global energy markets remain a potential risk factor.
Smart Data Insight
Master the Perfect Entry & Exit for this Stock
Don't leave your profits to chance. Historically, this stock follows specific seasonal patterns that institutional traders use to maximize returns.
- ✅ Identify the "Golden Buying Window"
- ✅ Avoid high-risk correction cycles
- ✅ Backtested data from the last 20+ years