January 24, 2026 a 11:44 am
PSX: Fibonacci Analysis - Phillips 66
Phillips 66 has demonstrated significant resilience over the past few months, showcasing an overall uptrend despite market volatility in the energy sector. The company's diverse segments, including Midstream, Chemicals, Refining, and Marketing and Specialties, have contributed to its robust financial performance. Investors might find Phillips 66 attractive, particularly given its strategic positions in various markets.
Fibonacci Analysis
| Start Date | End Date | High Point (Price/Date) | Low Point (Price/Date) |
|---|---|---|---|
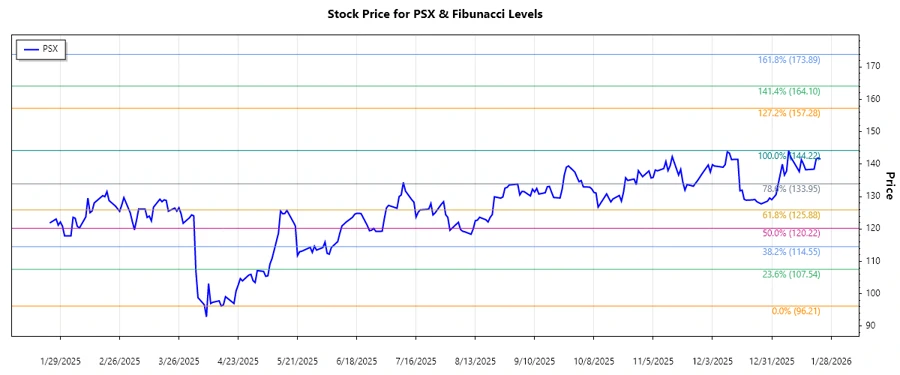
| 2025-04-02 | 2026-01-23 | 144.22 on 2026-01-08 | 96.21 on 2025-04-15 |
| Retracement Level | Price Level |
|---|---|
| 0.236 | 107.87 |
| 0.382 | 114.69 |
| 0.5 | 120.72 |
| 0.618 | 126.75 |
| 0.786 | 135.73 |
Currently, the stock price is at 141.54, placing it above all major Fibonacci retracement levels. It is not undergoing any active retracement, indicating strong upward momentum that surpasses usual resistance marks.
From a technical perspective, the stock is likely to find support if it retraces to any level but currently projects the possibility of further highs.
Conclusion
Phillips 66's pricing movements over the analyzed period highlight a solid bullish trajectory. While the energy market remains volatile, PSX's diversified business model reduces risk exposure and supports sustained growth. Technical analysis suggests strong support at lower levels, offering investment appeal during market dips. Though challenges exist within the broader sector, Phillips 66 appears well-positioned to weather uncertainties and capitalize on its existing market strengths.