
July 10, 2026 a 03:31 am

PSX: Dividend Analysis - Phillips 66
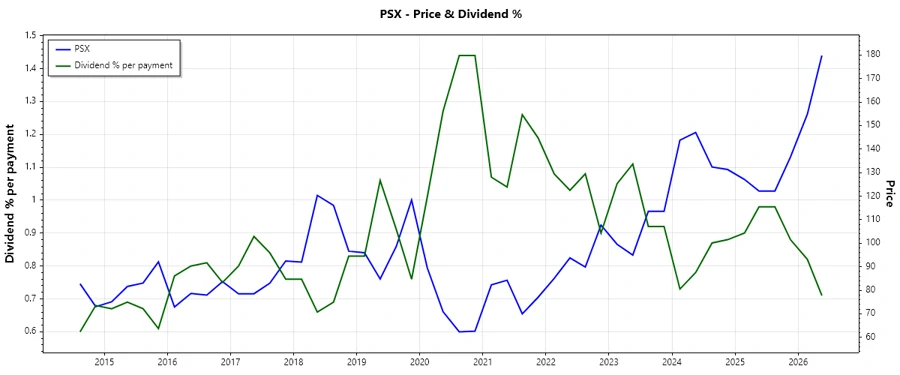
Phillips 66, a significant player in the energy sector, offers a robust dividend profile. The company's dividend yield is currently at 2.75%, with a stable history of dividend payments spanning 15 years, showcasing its commitment to returning capital to shareholders. Despite a competitive market, Phillips 66's steady dividend growth, paired with an attractive payout ratio, underscores a potentially rewarding investment for income-focused investors.
📊 Overview
Phillips 66 operates within the energy sector, which is renowned for its cyclical nature affecting dividend stability. The company's dividend yield stands at 2.75%, offering investors steady income amidst market volatility. Its current dividend per share is $4.73, with a commendable 15-year history of uninterrupted dividend payouts, indicating reliable capital returns. The absence of recent dividend cuts further solidifies investor confidence.
| Metric | Details |
|---|---|
| Sector | Energy |
| Dividend yield | 2.75 % |
| Current dividend per share | $4.73 USD |
| Dividend history | 15 years |
| Last cut or suspension | None |
📉 Dividend History
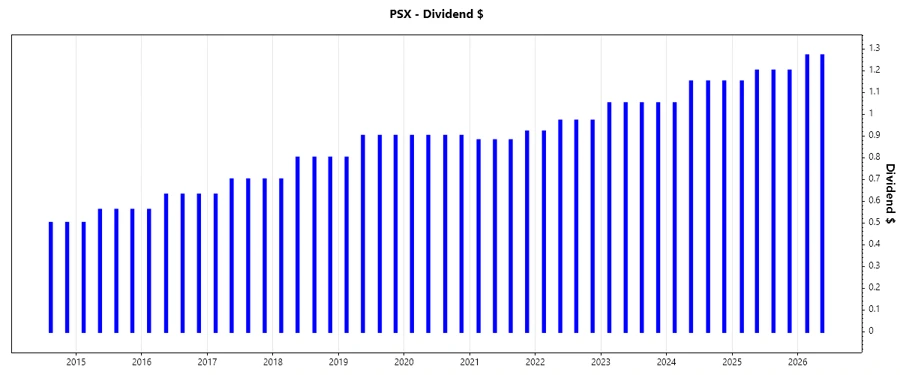
The consistency of Phillips 66's dividend history reflects disciplined financial management, appealing to investors seeking predictable income streams. Understanding past payments is crucial, as it highlights the commitment to shareholder returns.
| Year | Dividend per Share (USD) |
|---|---|
| 2026 | 2.54 |
| 2025 | 4.75 |
| 2024 | 4.50 |
| 2023 | 4.20 |
| 2022 | 3.83 |
📈 Dividend Growth
Dividend growth is an essential indicator of a company's financial health and its capacity to enhance shareholder value over time. Phillips 66 has shown growth in its dividends, which reinforces its potential as an attractive income investment.
| Time | Growth |
|---|---|
| 3 years | 7.44 % |
| 5 years | 5.70 % |
The average dividend growth is 5.70 % over 5 years. This shows moderate but steady dividend growth.
✅ Payout Ratio
Payout ratios are critical in assessing whether a company can sustain its dividends. An EPS-based payout ratio of 46.16% reflects a balanced approach, ensuring dividends are comfortably covered by earnings. In contrast, the high FCF-based payout ratio of 1594.95% raises caution, suggesting dividends might not be as well supported by free cash flows.
| Key Figure | Ratio |
|---|---|
| EPS-based | 46.16 % |
| Free cash flow-based | 1594.95 % |
While the EPS-based payout ratio suggests sustainability, the elevated FCF-based ratio indicates potential pressure on future dividend sustainability.
🗣️ Cashflow & Capital Efficiency
Monitoring cash flow and capital efficiency reveals insights into a company’s operational prowess and financial agility. While Phillips 66 exhibits favorable earnings yield, its CAPEX to Operating Cash Flow ratio of 95.26% suggests capital-intensive operations which might impact cash flow flexibility.
| Year | 2025 | 2024 | 2023 |
|---|---|---|---|
| Free Cash Flow Yield | 5.21% | 4.87% | 7.69% |
| Earnings Yield | 8.40% | 4.42% | 11.69% |
| CAPEX to Operating Cash Flow | 45.00% | 44.36% | 34.40% |
| Stock-based Compensation to Revenue | 0% | 0% | 0% |
| Free Cash Flow / Operating Cash Flow Ratio | 55% | 55.64% | 65.60% |
Analyzing these metrics, Phillip 66’s efficiency appears stable, though the dependence on operational funding hints at the necessity of careful cash management.
⚠️ Balance Sheet & Leverage Analysis
The balance sheet and leverage analysis unveil a firm’s financial structure and its capability to meet obligations. Phillips 66 maintains a moderate debt profile with debt-to-equity positioning at 0.79. Liquidity ratios suggest adequate short-term financial health.
| Year | 2025 | 2024 | 2023 |
|---|---|---|---|
| Debt-to-Equity | 0.79 | 0.73 | 0.63 |
| Debt-to-Assets | 0.31 | 0.28 | 0.26 |
| Debt-to-Capital | 0.44 | 0.42 | 0.39 |
| Net Debt to EBITDA | 2.39 | 3.06 | 1.30 |
| Current Ratio | 1.30 | 1.19 | 1.26 |
| Quick Ratio | 0.91 | 0.92 | 1.02 |
| Financial Leverage | 2.53 | 2.65 | 2.47 |
Phillip 66’s leverage metrics indicate sound financial management with room for potential debt restructuring, enhancing its operational resilience.
📋 Fundamental Strength & Profitability
These metrics provide insights into operational efficiency and profitability margins. Phillips 66 boasts solid profitability, with a return on equity of 22.90% in 2023, reflecting effective use of shareholder capital. Margin analysis shows consistent net margins, essential for sustained profitability.
| Year | 2025 | 2024 | 2023 |
|---|---|---|---|
| Return on Equity | 15.13% | 7.72% | 22.90% |
| Return on Assets | 5.98% | 2.92% | 9.28% |
| Net Profit Margin | 3.33% | 1.48% | 4.76% |
| EBIT Margin | 4.89% | 2.50% | 7.04% |
| Gross Margin | 4.91% | 3.40% | 7.66% |
| Research & Development to Revenue | 0% | 0% | 0% |
With strong ROE at 22.90%, Phillips 66 effectively maximizes shareholder value. Its profitability margins illustrate robust earnings capabilities within its operational model.
📈 Price Development
🔍 Dividend Scoring System
| Criteria | Score | Visualization |
|---|---|---|
| Dividend yield | 3 | |
| Dividend Stability | 4 | |
| Dividend growth | 3 | |
| Payout ratio | 2 | |
| Financial stability | 3 | |
| Dividend continuity | 4 | |
| Cashflow Coverage | 2 | |
| Balance Sheet Quality | 3 |
Total Score: 24/40
🗳️ Rating
Phillips 66 presents a moderate dividend profile with strengths in stability and continuity of dividend payments. Its financial strength and consistent profitability make it a reliable, albeit not aggressive, dividend play. The high free cash flow payout ratio, however, hints at potential cash flow pressures which investors should monitor. Overall, Phillips 66 warrants interest from income-seeking investors with a focus on stable dividends amid a mature market strategy.
Smart Data Insight
Master the Perfect Entry & Exit for this Stock
Don't leave your profits to chance. Historically, this stock follows specific seasonal patterns that institutional traders use to maximize returns.
- ✅ Identify the "Golden Buying Window"
- ✅ Avoid high-risk correction cycles
- ✅ Backtested data from the last 20+ years