April 29, 2026 a 03:31 pm
PSX: Dividend Analysis - Phillips 66
Phillips 66, a dominant player in the energy sector, presents a compelling dividend profile for potential investors. With a robust track record of 15 consecutive years of dividend payments, the company's commitment to returning value to shareholders is evident. The current dividend yield of 2.83% complements the company’s long-term growth strategy, making it a potential option for income-focused investors. Despite modest recent fluctuations, Phillips 66 demonstrates a strong ability to effectively manage its dividend policy, with a stable outlook for continued payouts.
Overview 📊
Understanding the fundamental aspects of Phillips 66's dividend performance is crucial. This overview presents essential metrics that highlight the company’s dividend characteristics:
| Metric | Detail |
|---|---|
| Sector | Energy |
| Dividend yield | 2.83% |
| Current dividend per share | $4.73 |
| Dividend history | 15 years |
| Last cut or suspension | None |
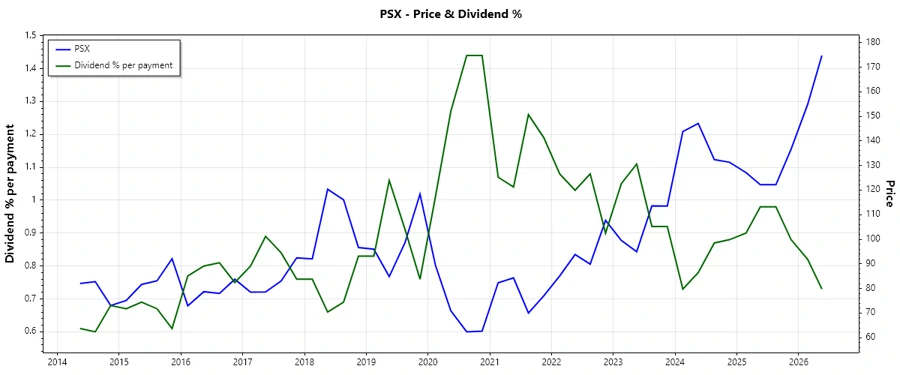
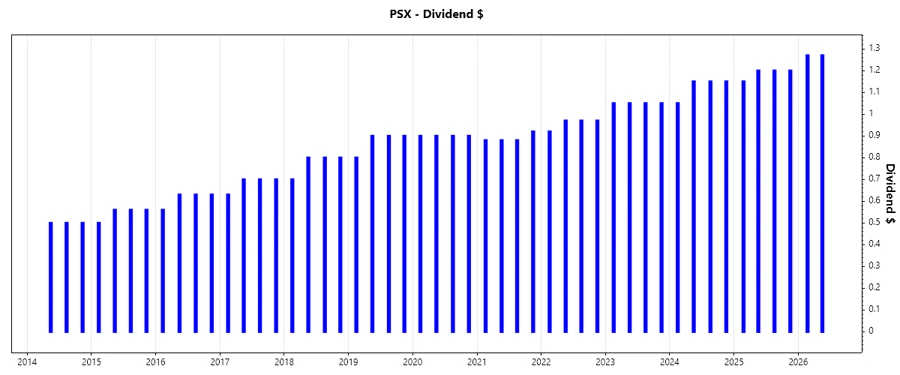
Dividend History 🗣️
The consistency and reliability of Phillips 66's dividend payments are demonstrated by its 15 years of uninterrupted payouts. This commitment underscores the company's focus on shareholder returns, even amidst economic volatility. Such a history provides confidence in the stock's return profile.
| Year | Dividend per Share (USD) |
|---|---|
| 2026 | $2.54 |
| 2025 | $4.75 |
| 2024 | $4.50 |
| 2023 | $4.20 |
| 2022 | $3.83 |
Dividend Growth 📈
Dividend growth is a critical measure of a company’s ability to increase shareholder value over time. Phillips 66 shows a modest growth rate, aligning with its steady income strategy.
| Time | Growth |
|---|---|
| 3 years | 7.44% |
| 5 years | 5.70% |
The average dividend growth is 5.70% over 5 years. This shows moderate but steady dividend growth, which is attractive to investors seeking gradual income increases.
Payout Ratio 📉
Payout ratio analysis provides insight into the sustainability of current dividend levels. Phillips 66 maintains a prudent approach to its earnings and free cash flow distribution.
| Key Figure | Ratio |
|---|---|
| EPS-based | 43.34% |
| Free cash flow-based | 69.56% |
The EPS payout ratio of 43.34% suggests a comfortable margin for Phillips 66 to maintain or gradually increase dividends, while the FCF payout ratio of 69.56% indicates a more aggressive use of cash flow, which needs careful monitoring.
Cashflow & Capital Efficiency ✅
A detailed analysis of cash flow and capital efficiency metrics for Phillips 66 provides clarity on its ability to fund dividends through operational activities.
| Metric | 2023 | 2024 | 2025 |
|---|---|---|---|
| Free Cash Flow Yield | 7.69% | 4.87% | 5.21% |
| Earnings Yield | 11.69% | 4.42% | 8.40% |
| CAPEX to Operating Cash Flow | 34.40% | 44.36% | 45.00% |
| Stock-based Compensation to Revenue | 0% | 0% | 0% |
| Free Cash Flow / Operating Cash Flow Ratio | 65.60% | 55.64% | 54.98% |
The cash flow stability and capital efficiency indicators suggest that Phillips 66 is well-positioned to support its dividend program. The company’s prudent capital expenditure strategy, relative to its operating cash flow, is a positive sign for dividend sustainability.
Balance Sheet & Leverage Analysis ⚠️
Examining Phillips 66's balance sheet and leverage ratios provides insights into its financial health and risk profile, crucial for long-term dividend reliability.
| Metric | 2023 | 2024 | 2025 |
|---|---|---|---|
| Debt-to-Equity | 63.30% | 73.20% | 78.65% |
| Debt-to-Assets | 25.64% | 27.64% | 31.06% |
| Debt-to-Capital | 38.76% | 42.26% | 44.03% |
| Net Debt to EBITDA | 1.30 | 3.06 | 2.23 |
| Current Ratio | 1.26 | 1.19 | 1.30 |
| Quick Ratio | 1.02 | 0.92 | 0.91 |
| Financial Leverage | 2.47 | 2.65 | 2.53 |
The analysis shows that Phillips 66 has a moderate level of leverage and maintains sufficient liquidity, supported by a healthy current and quick ratio. This positions the company favorably in fulfilling its debt obligations while sustaining dividend payments.
Fundamental Strength & Profitability 📊
Phillips 66's fundamental strength and profitability measures help determine its capability to generate profits and enhance shareholder value, pivotal for dividend sustainability.
| Metric | 2023 | 2024 | 2025 |
|---|---|---|---|
| Return on Equity | 22.90% | 7.72% | 15.13% |
| Return on Assets | 9.28% | 2.92% | 5.98% |
| Net Margin | 4.76% | 1.48% | 3.33% |
| EBIT Margin | 7.04% | 2.50% | 4.89% |
| EBITDA Margin | 8.40% | 4.18% | 7.38% |
| Gross Margin | 7.66% | 3.40% | 4.91% |
| R&D to Revenue | 0.00% | 0.01% | 0.00% |
Phillips 66 showcases strong return metrics, notably in 2023, highlighting its efficiency in capitalizing on investments and assets. This core strength enhances its ability to generate consistent profits, pivotal for supporting ongoing dividends.
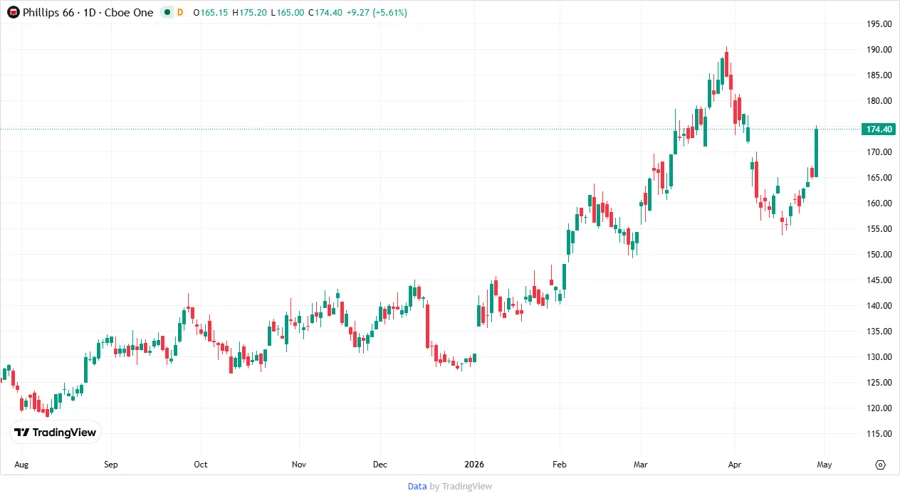
Price Development 📉
Dividend Scoring System 🔍
| Criteria | Score | Score Bar |
|---|---|---|
| Dividend yield | 3/5 | |
| Dividend stability | 5/5 | |
| Dividend growth | 3/5 | |
| Payout ratio | 4/5 | |
| Financial stability | 4/5 | |
| Dividend continuity | 5/5 | |
| Cashflow Coverage | 4/5 | |
| Balance Sheet Quality | 3/5 |
Total Score: 31/40
Rating ⭐
In conclusion, Phillips 66 presents as a reliable dividend stock, offering steady yields and robust payout history. While modest in growth, the company's commitment to consistent dividend payouts and strong underlying financial health position it as an attractive option for income-focused investors seeking stability. Our recommendation: Hold and consider for long-term income portfolio inclusion.
Smart Data Insight
Master the Perfect Entry & Exit for this Stock
Don't leave your profits to chance. Historically, this stock follows specific seasonal patterns that institutional traders use to maximize returns.
- ✅ Identify the "Golden Buying Window"
- ✅ Avoid high-risk correction cycles
- ✅ Backtested data from the last 20+ years