December 01, 2025 a 02:46 am

PSX: Dividend Analysis - Phillips 66
In the realm of dividend stocks, Phillips 66 stands out for its compelling blend of moderate yield and consistent growth. Despite a past cut, the company's dividend history spans an impressive 14 years, signaling steady shareholder returns. The robust growth in dividends per share reflects management's commitment to enhancing shareholder value.
📊 Overview
Phillips 66 operates within the energy sector, known for its reliable dividend payments. With a current dividend yield of 3.48% and a decade-plus of dividend history, the company has shown resilience and adaptability in fluctuating markets.
| Metric | Value |
|---|---|
| Sector | Energy |
| Dividend yield | 3.48% |
| Current dividend per share | 4.48 USD |
| Dividend history | 14 years |
| Last cut or suspension | 2021 |
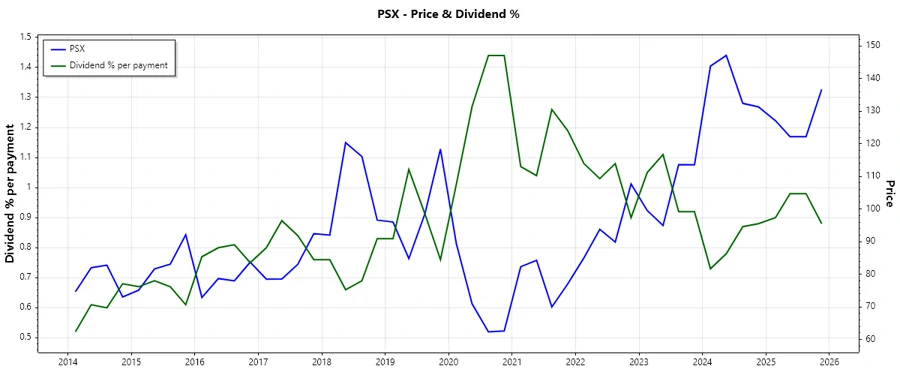
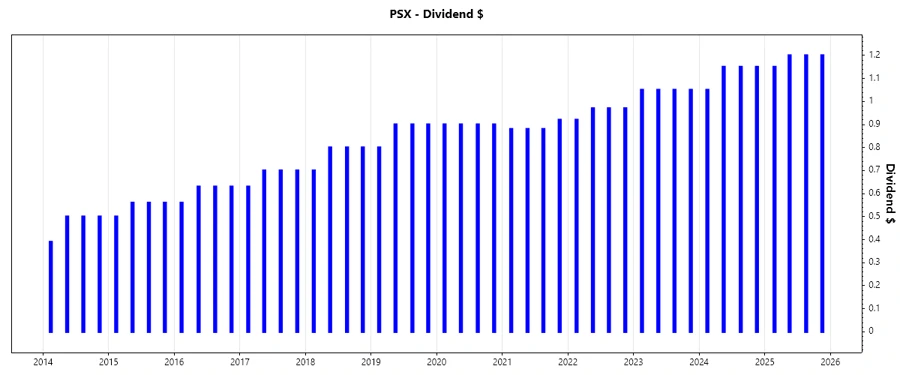
📈 Dividend History
Phillips 66's history of dividend payments reflects its strategic focus on long-term payout sustainability, evident in its 14-year history with only one suspension in recent years. This is crucial for investors focusing on income stability.
| Year | Dividend per Share (USD) |
|---|---|
| 2025 | 4.75 |
| 2024 | 4.50 |
| 2023 | 4.20 |
| 2022 | 3.83 |
| 2021 | 3.56 |
📉 Dividend Growth
Analyzing dividend growth helps assess future income potential. Currently, Phillips 66 demonstrates a moderate 5-year growth rate of 5.15%, highlighting consistent shareholder value enhancement despite sector challenges.
| Time | Growth |
|---|---|
| 3 years | 8.12% |
| 5 years | 5.15% |
The average dividend growth is 5.15% over 5 years. This shows moderate but steady dividend growth.
✅ Payout Ratio
The payout ratio is critical for assessing dividend sustainability. While the EPS-based ratio is elevated at 120.39%, the FCF-based ratio is more conservative at 62.19%, which suggests moderate payout levels aligning closer to operational cash generation.
| Key figure ratio | Percent |
|---|---|
| EPS-based | 120.39% |
| Free cash flow-based | 62.19% |
💵 Cashflow & Capital Efficiency
Strong cash flow metrics are essential, as they directly influence dividend payouts. Phillips 66 exhibits solid earning capabilities, with a free cash flow yield signaling operational efficiency. This is balanced by manageable CAPEX, reflecting strategic reinvestments.
| Year | Metric | 2024 | 2023 | 2022 |
|---|---|---|---|---|
| Free Cash Flow Yield | Free Cash Flow Yield | 4.87% | 7.69% | 17.56% |
| Earnings Yield | 4.42% | 11.69% | 22.46% | |
| CAPEX to Operating Cash Flow | 14.85% | 34.40% | 20.29% | |
| Stock-based Compensation to Revenue | 0% | 0% | 0% | |
| Free Cash Flow / Operating Cash Flow Ratio | 55.64% | 65.60% | 79.71% |
With a healthy cash flow coverage, Phillips 66 is well-positioned to manage its capital investments and sustain dividends, contributing to its financial resilience.
🔍 Balance Sheet & Leverage Analysis
A healthy balance sheet is pivotal for a company’s financial stability. Phillips 66 maintains a sound debt-to-equity ratio within the industry norm, ensuring flexibility in debt servicing and financial commitments.
| Year | Metric | 2024 | 2023 | 2022 |
|---|---|---|---|---|
| Leverage Ratios | Debt-to-Equity | 0.73 | 0.63 | 0.58 |
| Debt-to-Assets | 0.28 | 0.26 | 0.22 | |
| Debt-to-Capital | 0.42 | 0.39 | 0.37 | |
| Net Debt to EBITDA | 3.06 | 1.30 | 0.65 | |
| Liquidity Ratios | Current Ratio | 1.19 | 1.26 | 1.38 |
| Quick Ratio | 0.92 | 1.02 | 1.17 | |
| Financial Leverage | 2.65 | 2.47 | 2.59 |
The balance sheet metrics show a solid financial foundation, with stable leverage and sufficient liquidity to meet short-term liabilities efficiently.
🗣️ Fundamental Strength & Profitability
Evaluating profitability metrics like return on equity (ROE) and asset turnover reveals Phillips 66’s prowess in generating returns on investments, which is critical for sustaining robust dividends.
| Year | Metric | 2024 | 2023 | 2022 |
|---|---|---|---|---|
| Profitability Ratios | Return on Equity | 7.72% | 22.90% | 37.38% |
| Return on Assets | 2.92% | 9.28% | 14.42% | |
| Return on Invested Capital | 3.19% | 10.34% | 12.83% | |
| Margin Ratios | Net Margin | 1.48% | 4.76% | 6.48% |
| EBIT Margin | 2.50% | 7.04% | 8.97% | |
| EBITDA Margin | 4.18% | 8.40% | 9.94% |
Phillips 66's strong profitability indicators underscore its capacity to efficiently utilize assets and equity to generate consistent returns, crucial for its continuation as a dividend-paying entity.
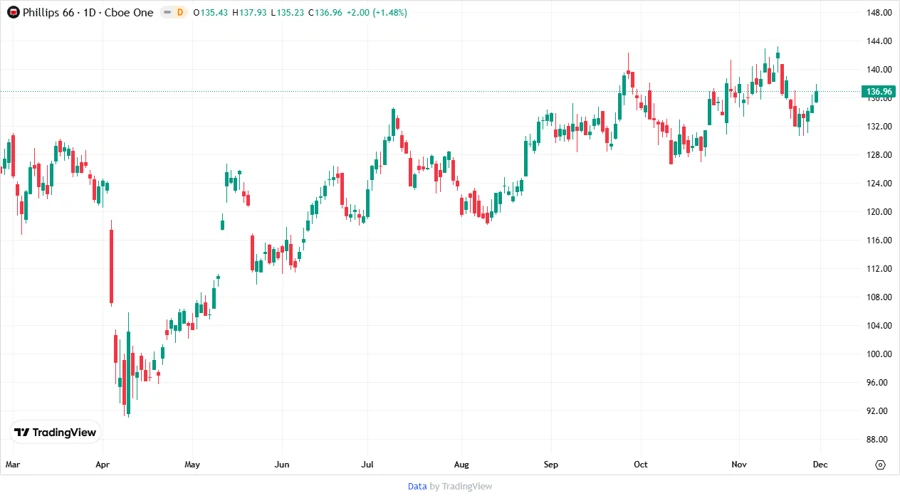
📊 Price Development
📈 Dividend Scoring System
| Category | Score | |
|---|---|---|
| Dividend yield | 4 | |
| Dividend Stability | 3 | |
| Dividend growth | 3 | |
| Payout ratio | 2 | |
| Financial stability | 4 | |
| Dividend continuity | 3 | |
| Cashflow Coverage | 4 | |
| Balance Sheet Quality | 5 |
Total Score: 28 out of 40
✅ Rating
Overall, Phillips 66 demonstrates a balanced dividend profile with moderate but consistent growth, sustained financial health, and a robust cash flow position. The company's capacity to maintain its payout ratio within a reasonable range, despite sector-specific challenges, places it as an attractive option for income-focused investors. While caution is advised due to the elevated EPS payout ratio, the overall assessment indicates a reliable dividend stock.