August 27, 2025 a 11:31 am

PSX: Dividend Analysis - Phillips 66
Our analysis of Phillips 66 reveals a company with a respectable dividend yield of 3.85% and a consistent history of paying dividends over the past 14 years. The company has managed to maintain its dividend payouts without any cuts or suspensions recently. However, the payout ratio exceeding 100% based on EPS warrants a closer examination of sustainability.
📊 Overview
Phillips 66 operates within a crucial sector of the economy. Its ability to sustain a nearly 4% dividend yield combined with a current dividend payout of approximately $4.48 per share reflects a robust commitment to return value to its shareholders. Spanning 14 years, its dividend history showcases resilience and dedication in maintaining investor trust.
| Metric | Details |
|---|---|
| Sector | Energy |
| Dividend Yield | 3.85% |
| Current Dividend Per Share | 4.48 USD |
| Dividend History | 14 years |
| Last Cut or Suspension | None |
🗣️ Dividend History
An uninterrupted 14-year dividend history illustrates Phillips 66's strong capacity to generate shareholder income. This track record fosters investor confidence, signifying financial robustness and stability which are essential for long-term investment strategies.
| Year | Dividend Per Share (USD) |
|---|---|
| 2025 | 3.55 |
| 2024 | 4.50 |
| 2023 | 4.20 |
| 2022 | 3.83 |
| 2021 | 3.56 |
📈 Dividend Growth
The growth in dividends is a key metric for assessing the potential for future increases in payout, which is attractive for income-focused investors. Phillips 66 has shown a modest 5.15% growth in dividends over the past 5 years, indicating a steady increase in payouts, although recent growth has been slower at 8.12% over the last 3 years.
| Time | Growth |
|---|---|
| 3 years | 8.12% |
| 5 years | 5.15% |
The average dividend growth of 5.15% over 5 years shows moderate but steady dividend growth, indicating Phillips 66's potential to maintain shareholder returns.
💹 Payout Ratio
Tracking payout ratios helps forecast the sustainability of dividend payments. Currently, Phillips 66's EPS-based payout ratio exceeds 104%, complemented by a free cash flow payout ratio of 121.65%. While high ratios can signal unsustainability, they also highlight the company's aggressive return strategy under favourable market conditions.
| Payout Ratio | Figure (%) |
|---|---|
| EPS-based | 104.17% |
| Free cash flow-based | 121.65% |
📈 Cashflow & Capital Efficiency
Understanding cash flow health and how capital is utilized influences predictions on a company's ability to sustain and grow its dividend. The evaluation of free cash flow, CAPEX, and stock-based compensation relative to revenue is necessary to gauge financial health and capital utilization.
| Year | 2024 | 2023 | 2022 |
|---|---|---|---|
| Free Cash Flow Yield | 4.87% | 7.69% | 17.56% |
| Earnings Yield | 4.42% | 11.69% | 22.46% |
| CAPEX to Op. Cash Flow | 44.36% | 34.40% | 20.29% |
| Stock-based Compensation to Revenue | 0% | 0% | 0.12% |
| Free Cash Flow/Operating Cash Flow Ratio | 55.64% | 65.60% | 79.71% |
Given these financial minute points, Phillips 66 demonstrates substantial capital efficiency and versatile cash flow management, necessary for maintaining dividends, even amidst varying capital expenditures.
💳 Balance Sheet & Leverage Analysis
Examining leverage metrics like debt ratios provides insight into financial health crucial for long-term dividend assurance. Phillips 66 maintains a stable balance sheet, indicated by the evolving debt-to-equity and other ratios across fiscal years.
| Year | 2024 | 2023 | 2022 |
|---|---|---|---|
| Debt-to-Equity | 0.73 | 0.63 | 0.58 |
| Debt-to-Assets | 0.28 | 0.26 | 0.22 |
| Debt-to-Capital | 0.42 | 0.39 | 0.37 |
| Net Debt to EBITDA | 3.06 | 1.30 | 0.65 |
| Current Ratio | 1.19 | 1.26 | 1.38 |
| Quick Ratio | 0.92 | 1.02 | 1.17 |
| Financial Leverage | 2.65 | 2.47 | 2.59 |
While an upward trend in debt-to-equity is apparent, manageable levels and strengthening quick and current ratios deem Phillips 66 as financially stable, fostering confidence for future dividends.
🔍 Fundamental Strength & Profitability
Analyzing profitability metrics like ROE and various margins encapsulates the company's financial prowess and strategic efficiency. Fluctuating yet improving figures highlight critical revenue generation capabilities supporting dividends.
| Year | 2024 | 2023 | 2022 |
|---|---|---|---|
| Return on Equity | 7.72% | 22.90% | 37.38% |
| Return on Assets | 2.92% | 9.28% | 14.42% |
| Net Margin | 1.48% | 4.75% | 6.49% |
| EBIT Margin | 2.53% | 7.05% | 8.98% |
| EBITDA Margin | 4.18% | 8.39% | 9.95% |
| Gross Margin | 7.56% | 7.57% | 10.84% |
| R&D to Revenue | 0% | 0.02% | 0.02% |
While some profit-related figures have seen declines, strategic operational improvements indicate ongoing resilience. Positive gains in key margins suggest initiative-driven profitability and sustainable dividend schemes.
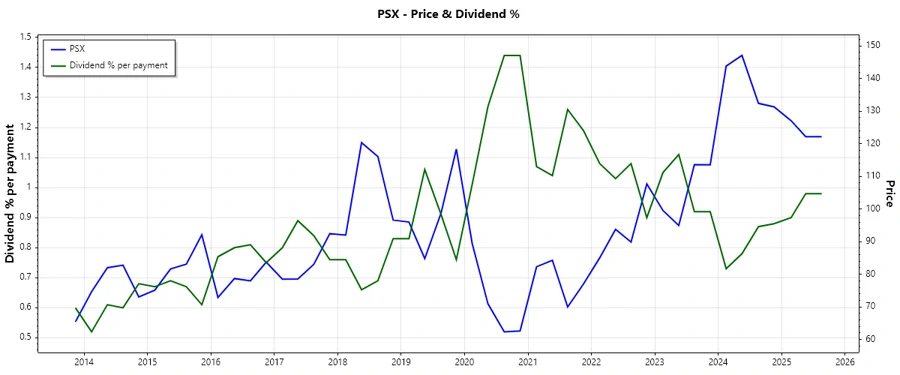
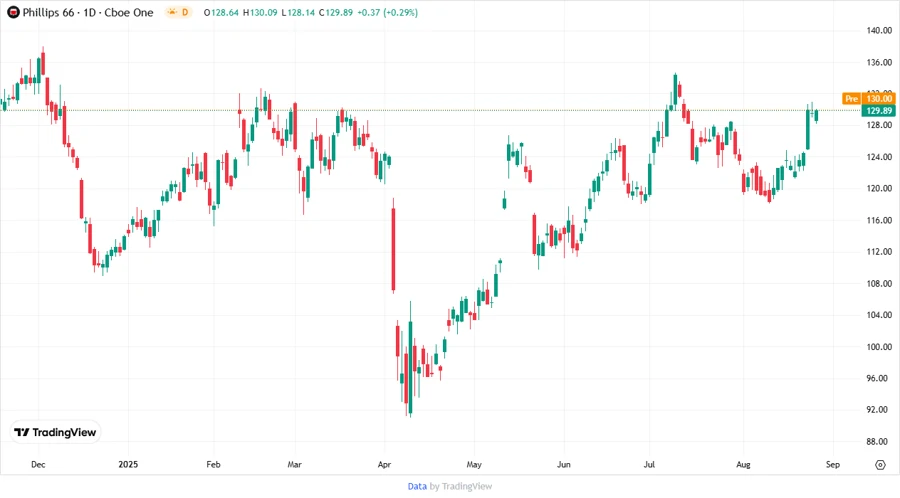
📉 Price Development
✅ Dividend Scoring System
| Category | Score (1-5) | Visual |
|---|---|---|
| Dividend yield | 4 | |
| Dividend Stability | 5 | |
| Dividend growth | 3 | |
| Payout ratio | 3 | |
| Financial stability | 4 | |
| Dividend continuity | 5 | |
| Cashflow Coverage | 3 | |
| Balance Sheet Quality | 4 |
Total Score: 31/40
🔔 Rating
The overall analysis categorizes Phillips 66 as a reliable dividend performer with strong historical payouts and resilience in financial operations. Despite some minor concerns about elevated payout ratios, the company's financial strategies and sector placement make it an attractive prospect for income-centric investors.
Smart Data Insight
Master the Perfect Entry & Exit for this Stock
Don't leave your profits to chance. Historically, this stock follows specific seasonal patterns that institutional traders use to maximize returns.
- ✅ Identify the "Golden Buying Window"
- ✅ Avoid high-risk correction cycles
- ✅ Backtested data from the last 20+ years