July 14, 2025 a 02:47 am


PSX: Dividend Analysis - Phillips 66
Phillips 66 is a prominent player in the energy sector, showcasing a robust dividend profile. With a solid history of 14 years of dividend payments and no recent cuts or suspensions, the company demonstrates a commitment to shareholder returns. Its current dividend yield of 3.81% is accompanied by steady growth, reflecting a strategic approach to dividend sustainability.
📊 Overview
The following table provides an at-a-glance summary of Phillips 66's key dividend metrics:
| Aspect | Details |
|---|---|
| Sector | Energy |
| Dividend Yield | 3.81% |
| Current Dividend per Share | $4.48 |
| Dividend History | 14 years |
| Last Cut or Suspension | None |
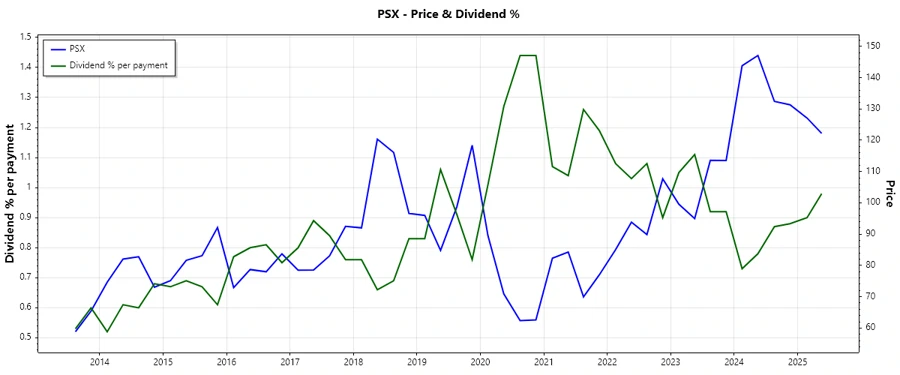
📈 Dividend History
The stability and consistency of dividend payments are critical for assessing a stock's attractiveness. Phillips 66's history reveals a commitment to increasing dividends, indicative of strong financial health and confidence in future performance.
| Year | Dividend per Share (USD) |
|---|---|
| 2025 | 2.35 |
| 2024 | 4.50 |
| 2023 | 4.20 |
| 2022 | 3.83 |
| 2021 | 3.56 |
📈 Dividend Growth
Assessing dividend growth provides insight into the company's future capacity for increasing shareholder returns. Sustained growth can signal robust financial management and potential for investor wealth enhancement.
| Time | Growth |
|---|---|
| 3 years | 8.12% |
| 5 years | 5.15% |
The average dividend growth is 5.15% over 5 years. This shows moderate but steady dividend growth.
✅ Payout Ratio
The payout ratio is a crucial indicator of how much profit is distributed to shareholders versus how much is retained in the company. A high payout ratio can imply limited reinvestment in growth, but it may also illustrate firm shareholder returns.
| Key Figure Ratio | Value |
|---|---|
| EPS-based | 98.75% |
| Free cash flow-based | 61.65% |
Phillips 66's payout ratios indicate a close alignment between dividends and earnings, as well as a strong cashflow support for distributed dividends. The EPS payout ratio of 98.75% suggests a significant portion of earnings is being returned to shareholders, whereas the FCF payout ratio of 61.65% shows a balanced approach.
🔍 Cashflow & Capital Efficiency
These metrics provide an understanding of how efficiently the company generates cash flow and manages its capital. It reflects the company's ability to sustain its dividend policy and fund growth.
| Metric | 2024 | 2023 | 2022 |
|---|---|---|---|
| Free Cash Flow Yield | 4.87% | 7.69% | 17.56% |
| Earnings Yield | 4.42% | 11.69% | 22.46% |
| CAPEX to Operating Cash Flow | 44.36% | 34.40% | 20.29% |
| Stock-based Compensation to Revenue | 0.00% | 0.00% | 0.12% |
| Free Cash Flow / Operating Cash Flow Ratio | 55.64% | 65.60% | 79.71% |
This exhibits a fundamental strength in maintaining both balance sheet stability and operational cash flows, reflecting Phillips 66's ability to sustain dividends and operational investments.
🏦 Balance Sheet & Leverage Analysis
The balance sheet and leverage ratios illustrate the company's financial stability, liquidity position, and capital structure robustness. These are pivotal for understanding the risk associated with the company's financial obligations.
| Metric | 2024 | 2023 | 2022 |
|---|---|---|---|
| Debt-to-Equity | 0.73 | 0.63 | 0.58 |
| Debt-to-Assets | 0.28 | 0.26 | 0.22 |
| Debt-to-Capital | 0.42 | 0.39 | 0.37 |
| Net Debt to EBITDA | 3.06 | 1.30 | 0.65 |
| Current Ratio | 1.23 | 1.26 | 1.38 |
| Quick Ratio | 0.92 | 1.02 | 1.17 |
| Financial Leverage | 2.65 | 2.47 | 2.59 |
Phillips 66's leverage indicators suggest a steady leverage position supported by solid asset management, underscoring financial robustness and prudent risk assessment.
🧮 Fundamental Strength & Profitability
Key profitability metrics provide insight into Phillips 66's operational efficiency and its ability to generate profits relative to its sales and investment levels.
| Metric | 2024 | 2023 | 2022 |
|---|---|---|---|
| Return on Equity | 7.72% | 22.90% | 37.38% |
| Return on Assets | 2.92% | 9.28% | 14.42% |
| Net Margin | 1.48% | 4.75% | 6.49% |
| EBIT Margin | 2.53% | 7.05% | 8.98% |
| EBITDA Margin | 4.18% | 8.39% | 9.95% |
| Gross Margin | 7.56% | 7.57% | 10.84% |
| R&D to Revenue | 0% | 0.018% | 0.025% |
These ratios point to a well-managed operation that adeptly balances profitability and operational deftness, leveraging competitive margin strength.
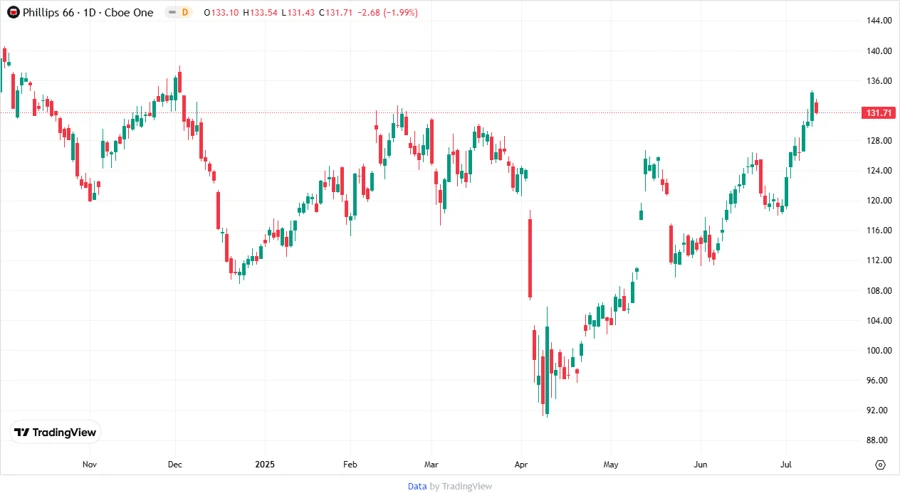
📉 Price Development
🔢 Dividend Scoring System
| Category | Score | Bar |
|---|---|---|
| Dividend Yield | 4 | |
| Dividend Stability | 5 | |
| Dividend Growth | 3 | |
| Payout Ratio | 3 | |
| Financial Stability | 4 | |
| Dividend Continuity | 5 | |
| Cashflow Coverage | 4 | |
| Balance Sheet Quality | 4 |
Total Score: 32/40
🗣️ Rating
Phillips 66 presents a compelling dividend investment case, with a richly layered financial profile that combines dividend stability with moderate growth prospects. Given its sound financial stability and continuity in dividend payments, it is a promising option for investors seeking steady income with potential for capital appreciation.
Smart Data Insight
Master the Perfect Entry & Exit for this Stock
Don't leave your profits to chance. Historically, this stock follows specific seasonal patterns that institutional traders use to maximize returns.
- ✅ Identify the "Golden Buying Window"
- ✅ Avoid high-risk correction cycles
- ✅ Backtested data from the last 20+ years