
June 21, 2026 a 11:44 am
PSA: Fibonacci Analysis - Public Storage
Public Storage (PSA) has demonstrated a consistent and notable upward trend in its stock performance over recent months. This has been a reflection of its strategic focus on expanding its self-storage operations across the United States and Europe. Investors are likely optimistic about continued growth, given the company's substantial real estate holdings and equity interests in related enterprises. The stock's recent technical performance further solidifies its potential as a robust investment opportunity in the real estate sector.
Fibonacci Analysis
| Analysis Parameter | Details |
|---|---|
| Trend Type | Uptrend |
| Start Date | 2025-12-01 |
| End Date | 2026-06-18 |
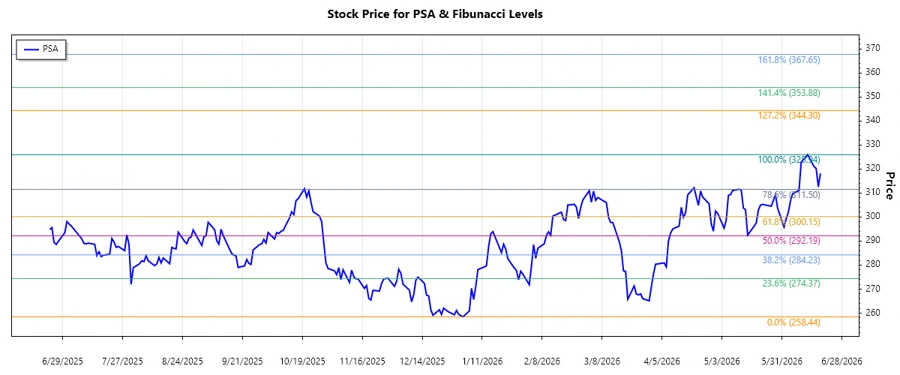
| High Point | $325.94 on 2026-06-12 |
| Low Point | $258.44 on 2026-01-02 |
| Fibonacci Levels |
|
| Current Market Condition | The current price ($318.12 on 2026-06-18) does not fall into a retracement zone, indicating a robust continuation of the uptrend. |
| Technical Interpretation | The absence of a retracement suggests strong support levels, potentially leading to further gains as momentum continues upward. |
Conclusion
The recent trajectory of Public Storage's stock (PSA) highlights considerable growth potential, based on its operational advancements and expanding market presence. With a strong uptrend and absence of significant retracement in recent days, the stock presents a promising opportunity for investors seeking exposure to the real estate investment trust sector. However, it is crucial to remain cautious of potential market volatility and unforeseen macroeconomic factors that may impact future performance. Analysts should consider these findings as they recalibrate their positions and assess market trends.
Smart Data Insight
Master the Perfect Entry & Exit for this Stock
Don't leave your profits to chance. Historically, this stock follows specific seasonal patterns that institutional traders use to maximize returns.
- ✅ Identify the "Golden Buying Window"
- ✅ Avoid high-risk correction cycles
- ✅ Backtested data from the last 20+ years