
July 07, 2026 a 02:46 am

PSA: Dividend Analysis - Public Storage
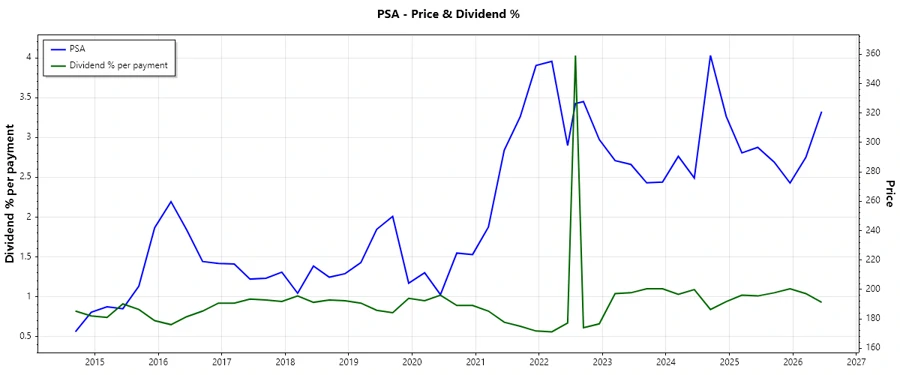
Public Storage has demonstrated a consistent dividend history over 42 years, with a current dividend yield of 3.74%. While recent growth rates have been modest, the company's solid position in the market cap segment suggests reliability. Investors might view the high payout ratios carefully, but overall stability remains a key feature of PSA's dividend profile.
📊 Overview
Public Storage operates in a sector known for its resiliency, particularly appealing to income-focused investors. The company's dividend history and yield provide a compelling proposition.
| Metric | Value |
|---|---|
| Sector | Real Estate |
| Dividend Yield | 3.74 % |
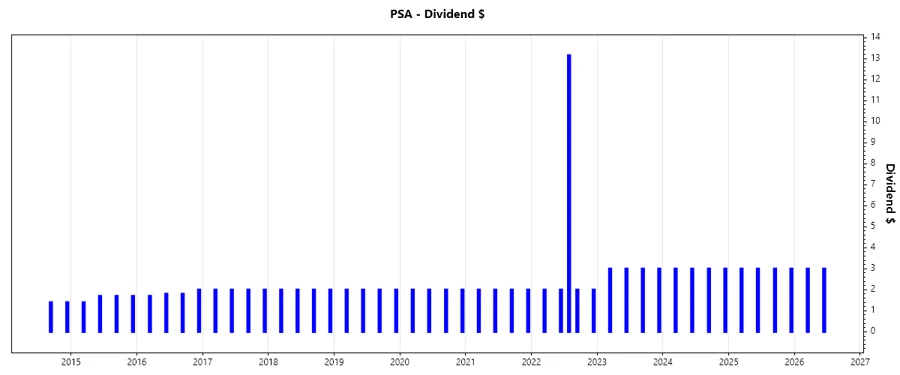
| Current Dividend per Share | 13.13 USD |
| Dividend History | 42 years |
| Last Cut/Suspension | None |
📈 Dividend History
The company's lengthy dividend history is indicative of a reliable dividend payment strategy. This stability can attract investors seeking a steady income stream.
| Year | Dividend Per Share |
|---|---|
| 2026 | 6 USD |
| 2025 | 12 USD |
| 2024 | 12 USD |
| 2023 | 12 USD |
| 2022 | 21.15 USD |
📊 Dividend Growth
Dividend growth is a critical factor, indicating how a company's dividend payments have increased over time. It reflects a company's earning power and commitment to returning capital to shareholders.
| Time | Growth |
|---|---|
| 3 years | -0.17 % |
| 5 years | 0.08 % |
The average dividend growth is 0.08% over 5 years. This shows moderate but steady dividend growth.
🧮 Payout Ratio
Payout ratios are essential to evaluate whether a company's dividend payments are sustainable in the long term. High payout ratios might indicate less room for future dividend increases.
| Key figure | Ratio |
|---|---|
| EPS-based | 121.10 % |
| Free cash flow-based | 75.22 % |
The EPS payout ratio of 121.10% suggests that the dividends paid exceed earnings, which could be unsustainable, whereas the FCF-based ratio of 75.22% is more manageable.
💰 Cashflow & Capital Efficiency
The cash flow analysis provides insight into the company's ability to generate cash from its operations, crucial for covering dividends and reinvestment needs. Capital efficiency metrics reflect how well a company utilizes its capital to generate income.
| Metric | 2023 | 2024 | 2025 |
|---|---|---|---|
| Free Cash Flow Yield | 5.21 % | 5.16 % | 6.36 % |
| Earnings Yield | 3.34 % | 3.95 % | 3.92 % |
| CAPEX / Operating Cash Flow | 14.20 % | 13.43 % | 9.08 % |
| Stock Compensation / Revenue | 0.92 % | 0.95 % | 0.83 % |
| Free Cash Flow / Operating Cash Flow | 85.80 % | 86.57 % | 90.92 % |
| Return on Invested Capital | 12.01 % | 11.46 % | 11.50 % |
The data suggests PSA has a robust cash flow position, and efficient capital allocation strategies are in place to maximize income.
🔍 Balance Sheet & Leverage Analysis
A strong balance sheet is critical for evaluating a company's financial stability. Leverage ratios help assess the risks associated with debt exposure.
| Metric | 2023 | 2024 | 2025 |
|---|---|---|---|
| Debt-to-Equity | 0.91 | 0.96 | 1.11 |
| Debt-to-Assets | 0.46 | 0.47 | 0.51 |
| Debt-to-Capital | 0.48 | 0.49 | 0.53 |
| Net Debt to EBITDA | 2.61 | 2.54 | 3.06 |
| Current Ratio | 0.62 | 0.76 | 0.75 |
| Quick Ratio | 0.62 | 0.76 | 0.75 |
| Financial Leverage | 1.98 | 2.03 | 2.19 |
The leverage ratios indicate a careful balance between debt and equity, suggesting effective management of financial obligations.
💪 Fundamental Strength & Profitability
Fundamental strength and profitability ratios highlight a company's efficiency and ability to generate returns for investors.
| Metric | 2023 | 2024 | 2025 |
|---|---|---|---|
| Return on Equity | 21.45 % | 21.33 % | 19.29 % |
| Return on Assets | 10.85 % | 10.49 % | 8.83 % |
| Net Margin | 47.55 % | 44.13 % | 36.99 % |
| EBIT Margin | 52.51 % | 50.61 % | 43.41 % |
| EBITDA Margin | 73.98 % | 74.67 % | 67.29 % |
| Gross Margin | 74.59 % | 73.21 % | 24.96 % |
| R&D / Revenue | 0 % | 0 % | 0 % |
PSA displays a strong profitability framework, with high returns on equity and assets, supporting its cost-effective operational structure.
🗣️ Price Development
📝 Dividend Scoring System
| Criteria | Score (1-5) | Score Bar |
|---|---|---|
| Dividend yield | 4 | |
| Dividend Stability | 5 | |
| Dividend growth | 3 | |
| Payout ratio | 3 | |
| Financial stability | 4 | |
| Dividend continuity | 5 | |
| Cashflow Coverage | 4 | |
| Balance Sheet Quality | 4 |
Overall Score: 32/40
Rating
Public Storage provides a reliable dividend profile with a firm foundation in its sector. Despite some challenges in payout sustainability, the company maintains robust financial metrics, suggesting confidence in the continuation of dividends. Investors should monitor the payout ratios, but PSA remains a credible choice for dividend-focused portfolios.
Smart Data Insight
Master the Perfect Entry & Exit for this Stock
Don't leave your profits to chance. Historically, this stock follows specific seasonal patterns that institutional traders use to maximize returns.
- ✅ Identify the "Golden Buying Window"
- ✅ Avoid high-risk correction cycles
- ✅ Backtested data from the last 20+ years