
April 19, 2026 a 03:31 pm

PSA: Dividend Analysis - Public Storage
The dividend profile of Public Storage (PSA) is characterized by a robust dividend yield and a long history of dividend payments. Despite a challenging growth rate in recent years, the company maintains its position as a reliable income stock. Investors seeking stable dividends may find PSA a suitable addition to their portfolio.
📊 Overview
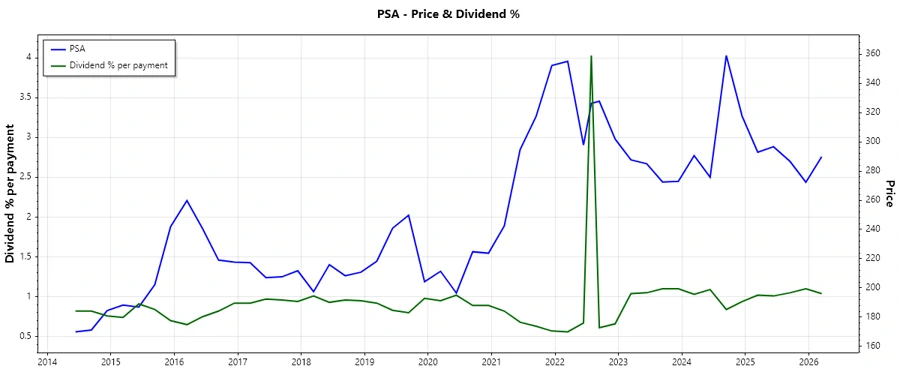
Public Storage, operating in the real estate sector, presents a compelling dividend profile. The company boasts a substantial dividend yield of 4.14%, a current dividend per share set at $13.13, and a remarkable 42-year history of consistent dividend payments without any recent cuts or suspensions — emphasizing its commitment to returning value to shareholders.
| Sector | Dividend yield | Current dividend per share | Dividend history | Last cut or suspension |
|---|---|---|---|---|
| Real Estate | 4.14% | 13.13 USD | 42 years | None |
🗣️ Dividend History
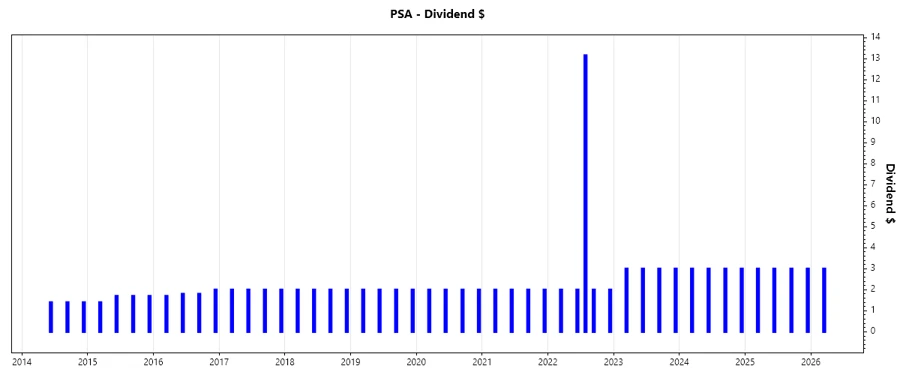
The dividend history of PSA demonstrates strong and reliable payouts over the years, which is crucial for income-focused investors. A consistent history of dividend distribution can be a sign of a company's financial health and stability.
| Year | Dividend per Share (USD) |
|---|---|
| 2026 | 3 |
| 2025 | 12 |
| 2024 | 12 |
| 2023 | 12 |
| 2022 | 21.15 |
📈 Dividend Growth
The growth of dividends is an essential metric, indicating the potential for income to increase over time, which can protect against inflation. However, PSA's dividend growth has been relatively flat, with a decrease over 3 years and a modest growth over 5 years.
| Time | Growth |
|---|---|
| 3 years | -0.17% |
| 5 years | 0.08% |
The average dividend growth is 0.08% over 5 years. This shows moderate but steady dividend growth.
✅ Payout Ratio
Payout ratios provide insight into how much of a company's earnings are returned to shareholders as dividends. PSA shows a concerning EPS-based payout ratio of 129.10%, which is unsustainable in the long run, while the free cash flow-based payout ratio stands at 74.66%, indicating better but still high levels of payout.
| Key figure | Ratio |
|---|---|
| EPS-based | 129.10% |
| Free cash flow-based | 74.66% |
The high EPS payout ratio suggests potential risks of dividend cuts if earnings decline, while the FCF payout ratio is at an acceptable level for maintaining dividends.
⚠️ Cashflow & Capital Efficiency
Analyzing cash flow metrics provides a clearer picture of a company's capital efficiency. PSA's cash flow yields and the ratio of CAPEX to operating cash flow display its operational effectiveness in generating free cash flow relative to its spending.
| Year | 2025 | 2024 | 2023 |
|---|---|---|---|
| Free Cash Flow Yield | 6.36% | 5.16% | 5.20% |
| Earnings Yield | 3.92% | 3.95% | 4.01% |
| CAPEX to Operating Cash Flow | 9.08% | 13.43% | 14.20% |
| Stock-based Compensation to Revenue | 0.83% | 0.95% | 0.92% |
| Free Cash Flow / Operating Cash Flow Ratio | 90.92% | 86.57% | 85.80% |
These figures suggest PSA efficiently converts earnings into cash and allocates capital effectively, although the increasing CAPEX percentage could indicate rising investment needs.
⚖️ Balance Sheet & Leverage Analysis
A company's leverage ratios reflect its debt levels compared to its equity and other financial metrics. Understanding these can provide insights into financial stability and risk.
| Year | 2025 | 2024 | 2023 |
|---|---|---|---|
| Debt-to-Equity | 1.11 | 0.96 | 0.91 |
| Debt-to-Assets | 50.74% | 47.35% | 45.95% |
| Debt-to-Capital | 52.58% | 49.06% | 47.62% |
| Net Debt to EBITDA | 3.06 | 2.54 | 2.61 |
| Current Ratio | 0.75 | 0.76 | 0.62 |
| Quick Ratio | 0.75 | 0.76 | 0.62 |
PSA maintains manageable debt levels with a stable debt-to-equity ratio and relatively strong liquidity, as reflected by its current and quick ratios.
💪 Fundamental Strength & Profitability
Profitable companies are generally more sustainable and capable of weathering economic cycles, making profitability metrics critical for analysis.
| Year | 2025 | 2024 | 2023 |
|---|---|---|---|
| Return on Equity | 19.29% | 21.33% | 21.45% |
| Return on Assets | 8.83% | 10.49% | 10.85% |
| Net Profit Margin | 36.99% | 44.13% | 47.55% |
| Gross Margin | 24.96% | 73.21% | 74.59% |
| EBIT Margin | 43.41% | 50.61% | 52.51% |
PSA's profitability metrics demonstrate strong returns on equity and assets, indicating effective management and operational efficiency.
📉 Price Development
📊 Dividend Scoring System
| Criteria | Score | Visual |
|---|---|---|
| Dividend yield | 4 | |
| Dividend Stability | 5 | |
| Dividend growth | 2 | |
| Payout ratio | 3 | |
| Financial stability | 4 | |
| Dividend continuity | 5 | |
| Cashflow Coverage | 4 | |
| Balance Sheet Quality | 4 |
Total Score: 31/40
🗨️ Rating
Public Storage (PSA) offers a strong dividend profile supported by consistent payout history and overall financial stability, making it an attractive choice for dividend-focused investors. While recent growth metrics are modest, PSA's financial foundations and reliable dividend scheme provide a considerable defense against market uncertainties.
Smart Data Insight
Master the Perfect Entry & Exit for this Stock
Don't leave your profits to chance. Historically, this stock follows specific seasonal patterns that institutional traders use to maximize returns.
- ✅ Identify the "Golden Buying Window"
- ✅ Avoid high-risk correction cycles
- ✅ Backtested data from the last 20+ years