March 20, 2026 a 07:31 am

PSA: Dividend Analysis - Public Storage
Public Storage, renowned for its reliability in dividend payments over the years, continues to capture investors’ attention with its substantial dividend yield. Despite recent dividend growth challenges, its long history of consistent payouts instills confidence. Analyzing its financial metrics reveals insights into its robust profitability and capital efficiency.
📊 Overview
Public Storage is a key player in the real estate sector known for its robust dividend profile, offering a generous yield, but facing recent growth challenges.
| Metric | Value |
|---|---|
| Sector | Real Estate |
| Dividend yield | 4.14 % |
| Current dividend per share | 13.13 USD |
| Dividend history | 42 years |
| Last cut or suspension | None |
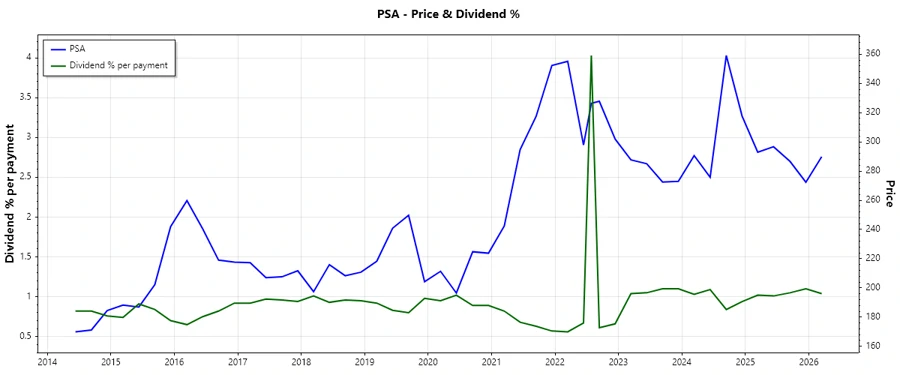
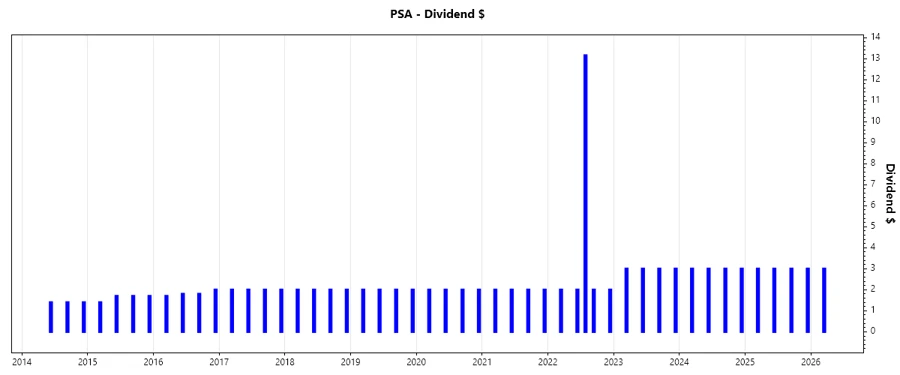
🗣️ Dividend History
The consistent, long-standing history of dividend payments exemplifies stability and reliability. Maintaining such history is crucial as it reflects the company’s consistent cash flow generation and financial health.
| Year | Dividend per Share (USD) |
|---|---|
| 2026 | 3.00 |
| 2025 | 12.00 |
| 2024 | 12.00 |
| 2023 | 12.00 |
| 2022 | 21.15 |
📈 Dividend Growth
Analyzing growth provides insights into future dividend capacity and sustainability. A negative three-year growth suggests recent challenges, whereas long-term growth stability is crucial for investor confidence.
| Time | Growth |
|---|---|
| 3 years | -0.17 % |
| 5 years | 0.08 % |
The average dividend growth is 0.08 % over 5 years. This shows moderate but steady dividend growth.
📉 Payout Ratio
Payout ratios indicate the sustainability of dividend distributions relative to earnings and cash flow. Elevated levels may suggest limited growth potential or financial strain.
| Key Figure | Ratio |
|---|---|
| EPS-based | 129.10 % |
| Free cash flow-based | 74.66 % |
The high EPS-based payout ratio (129.10 %) may indicate a strain on earnings, while a 74.66 % FCF payout suggests a considerable portion of cash flow is allocated to dividends, warranting close financial scrutiny.
✅ Cashflow & Capital Efficiency
Strong cash flow and efficient capital allocation underpin dividend capabilities and corporate growth. Analyzing these metrics helps evaluate financial flexibility and underlying operational health.
| Metric | 2025 | 2024 | 2023 |
|---|---|---|---|
| Free Cash Flow Yield | 6.36% | 5.16% | 5.20% |
| Earnings Yield | 3.92% | 3.95% | 4.01% |
| CAPEX to Operating Cash Flow | 9.08% | 13.43% | 14.20% |
| Stock-based Compensation to Revenue | 0.83% | 0.95% | 0.92% |
| Free Cash Flow / Operating Cash Flow Ratio | 90.92% | 86.57% | 85.80% |
The cash flow output's stability and efficiency suggest sustainable capital management, though rising CAPEX might increase future fiscal obligations, signaling considerations for growth versus present costs.
🔍 Balance Sheet & Leverage Analysis
Understanding a company's balance sheet is critical for assessing risk, capital structure, and its ability to sustain debt repayments. We consider key leverage metrics and liquidity indicators.
| Metric | 2025 | 2024 | 2023 |
|---|---|---|---|
| Debt-to-Equity | 110.88% | 96.30% | 90.91% |
| Debt-to-Assets | 50.74% | 47.35% | 45.95% |
| Debt-to-Capital | 52.58% | 49.06% | 47.62% |
| Net Debt to EBITDA | 3.06 | 2.54 | 2.61 |
| Current Ratio | 0.75 | 0.76 | 0.62 |
| Quick Ratio | 0.75 | 0.76 | 0.62 |
| Financial Leverage | 2.19 | 2.03 | 1.98 |
The current ratio and quick ratio suggest tight short-term liquidity, while improving financial leverage and stable debt indicators integrate prudence in leveraging strategies, underscoring sound fiscal footing.
📊 Fundamental Strength & Profitability
Assessing profitability and fundamental strength gives insights into long-term viability and operational margins. Analyzing trends across these metrics helps in evaluating core business efficiency.
| Metric | 2025 | 2024 | 2023 |
|---|---|---|---|
| Return on Equity | 19.29% | 21.33% | 21.45% |
| Return on Assets | 8.83% | 10.49% | 10.85% |
| Margins | |||
| Net Margin | 36.99% | 44.13% | 47.55% |
| EBIT Margin | 43.41% | 50.61% | 52.51% |
| EBITDA Margin | 67.29% | 74.67% | 73.98% |
| Gross Margin | 24.96% | 73.21% | 74.59% |
| R&D to Revenue | 0.00% | 0.00% | 0.00% |
Return metrics continue to paint a favorable financial picture, fostering confidence in shares and sustaining dividends, whereas R&D omitted investment may impact future competitiveness without strategic pivots.
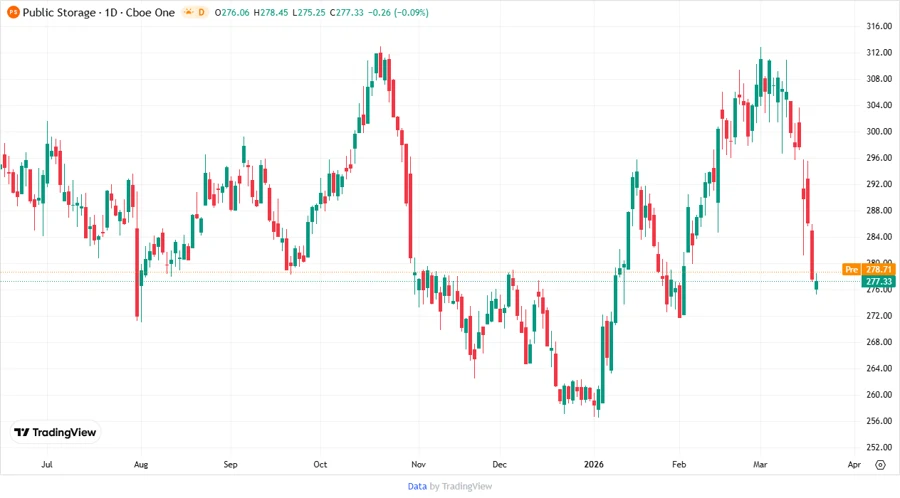
🔎 Price Development
📉 Dividend Scoring System
| Category | Score (out of 5) | Score Bar |
|---|---|---|
| Dividend yield | 4 | |
| Dividend Stability | 4 | |
| Dividend Growth | 2 | |
| Payout Ratio | 2 | |
| Financial Stability | 3 | |
| Dividend Continuity | 5 | |
| Cashflow Coverage | 3 | |
| Balance Sheet Quality | 3 |
Total Score: 26/40
🗳️ Rating & Recommendation
Public Storage demonstrates a favorable but currently subdued dividend profile with vital financial metrics supporting consistency and prospects for future improvements. Monitoring for growth resumption or strategic adaptations can enhance its investment appeal further.