August 02, 2025 a 12:47 pm
PSA: Dividend Analysis - Public Storage
Public Storage offers a solid dividend profile with consistent payments over four decades, showcasing financial stability. Despite a high payout ratio, the company maintains a competitive dividend yield, largely bolstered by its substantial cash flow from operations.
📊 Overview
Public Storage operates in the Real Estate sector, providing various self-storage solutions across the United States. The company's dividends are a significant attraction for investors, featuring a well-above-average yield and a robust history of payments.
| Sector | Dividend Yield | Current Dividend per Share | Dividend History | Last Cut or Suspension |
|---|---|---|---|---|
| Real Estate | 4.05% | 13.13 USD | 41 years | None |
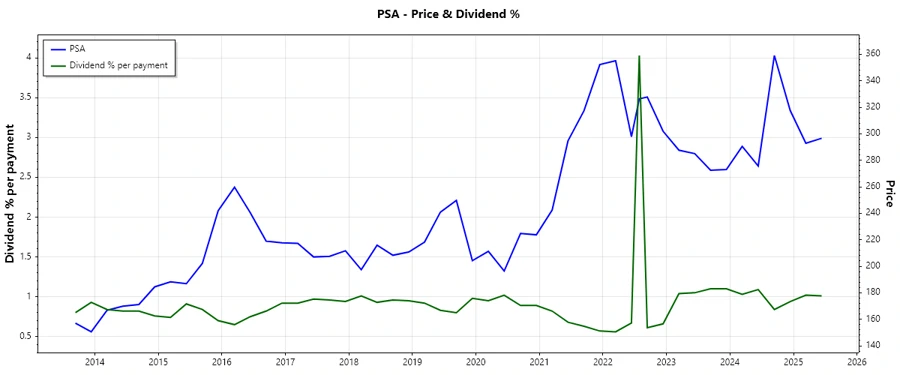
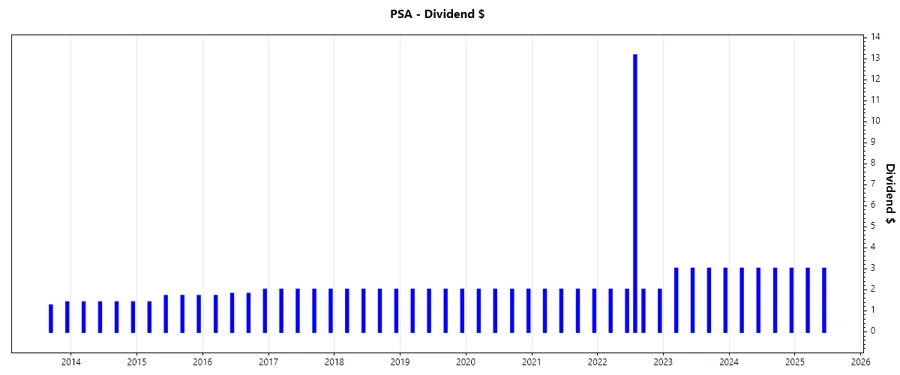
📈 Dividend History
Public Storage has a strong dividend history, emphasizing stability and growth without interruptions. This reliability enhances the company's reputation among income-focused investors.
| Year | Dividend per Share (USD) |
|---|---|
| 2025 | 6 |
| 2024 | 12 |
| 2023 | 12 |
| 2022 | 21.15 |
| 2021 | 8 |
📈 Dividend Growth
Examining dividend growth offers insight into how rapidly shareholder returns might increase. Steady growth is indicative of sustainable financial performance.
| Time | Growth |
|---|---|
| 3 years | 14.47% |
| 5 years | 8.45% |
The average dividend growth is 8.45% over 5 years. This shows moderate but steady dividend growth.
📉 Payout Ratio
The payout ratio reflects the proportion of earnings or cash flow distributed as dividends. It's a critical indicator of dividend sustainability and financial health.
| Key Figure | Ratio |
|---|---|
| EPS-based | 126.95% |
| Free cash flow-based | 78.57% |
The EPS-based payout ratio exceeds 100%, indicating dividends are paid from capital reserves, whereas the free cash flow-based ratio is more manageable, pointing to operational cash efficiency.
🗣️ Cashflow & Capital Efficiency
Assessing free cash flow yield and capital efficiency metrics helps evaluate the company's ability to fund dividends and reinvest in its growth.
| Year | 2024 | 2023 | 2022 |
|---|---|---|---|
| Free Cash Flow Yield | 5.16% | 5.20% | 5.41% |
| Earnings Yield | 3.95% | 4.01% | 8.86% |
| CAPEX to Operating Cash Flow | 13.43% | 14.20% | 14.75% |
| Stock-based Compensation to Revenue | 0.95% | 0.92% | 1.36% |
| Free Cash Flow / Operating Cash Flow Ratio | 86.57% | 85.80% | 85.25% |
Efficient cash flow management allows Public Storage to sustainably cover dividends and pursue growth strategies, indicative of robust capital efficiency and reinvestment capability.
⚖️ Balance Sheet & Leverage Analysis
A strong balance sheet provides reassurance of a company's financial health and risk management capability.
| Year | 2024 | 2023 | 2022 |
|---|---|---|---|
| Debt-to-Equity | 0.963 | 0.909 | 0.682 |
| Debt-to-Assets | 0.473 | 0.460 | 0.391 |
| Debt-to-Capital | 0.491 | 0.476 | 0.405 |
| Net Debt to EBITDA | 2.54 | 2.61 | 1.61 |
| Current Ratio | 0.761 | 0.618 | 1.506 |
| Quick Ratio | 0.761 | 0.618 | 1.506 |
| Financial Leverage | 2.034 | 1.978 | 1.742 |
The steady debt-to-equity ratio and robust quick ratio hint at satisfactory liquidity and controlled leverage, suggesting a well-balanced financial posture.
🏅 Fundamental Strength & Profitability
Evaluating profitability metrics enables insights into operational efficiency and return on investment.
| Year | 2024 | 2023 | 2022 |
|---|---|---|---|
| Return on Equity | 21.33% | 21.45% | 43.17% |
| Return on Assets | 10.49% | 10.85% | 24.78% |
| Margins: Net | 44.13% | 47.55% | 103.99% |
| EBIT Margin | 50.61% | 52.51% | 108.00% |
| EBITDA Margin | 74.67% | 73.98% | 90.72% |
| Gross Margin | 73.21% | 74.26% | 74.82% |
| R&D to Revenue | 0% | 0% | 0.42% |
With high returns on equity and assets, Public Storage demonstrates substantial profitability. These metrics indicate efficient management and operational excellence.
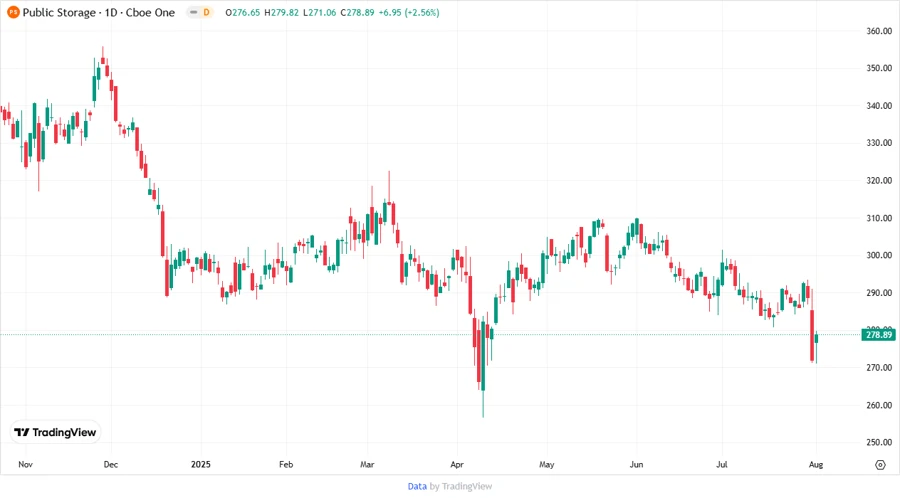
Price Development
✅ Dividend Scoring System
| Category | Score | Visualization |
|---|---|---|
| Dividend yield | 4/5 | |
| Dividend Stability | 5/5 | |
| Dividend growth | 3/5 | |
| Payout ratio | 2/5 | |
| Financial stability | 4/5 | |
| Dividend continuity | 5/5 | |
| Cashflow Coverage | 4/5 | |
| Balance Sheet Quality | 4/5 |
Overall Score: 31/40
🔍 Rating
Public Storage holds a commendable dividend profile marked by consistent payments and significant yield. While high payout ratios might raise concerns, the robust cash flows and distinguished history provide a solid foundation. 📈