August 13, 2025 a 09:03 am

PRU: Trend and Support & Resistance Analysis - Prudential Financial, Inc.
Prudential Financial, Inc. operates in the insurance and investment management sectors, providing a range of financial products and services both in the US and internationally. The company's diverse operations span multiple segments, presenting it as a robust player in the financial industry. Recent technical indicators suggest a potential shift in the stock's performance, highlighting significant trading zones of interest for investors.
Trend Analysis
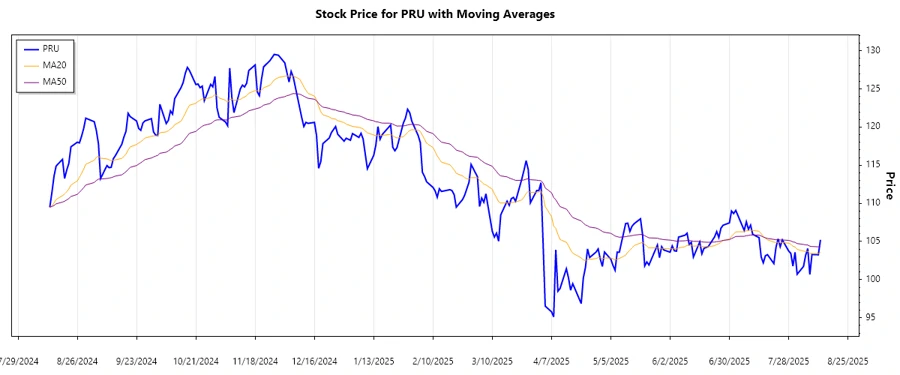
In analyzing the daily closing prices of Prudential Financial, Inc., the EMA20 and EMA50 were calculated to determine the prevailing trend. The EMAs provide insights into whether the stock is in an upward, downward, or sideways trend. Based on the recent data, the current indications are as follows:
| Date | Closing Price | Trend |
|---|---|---|
| 2025-08-12 | 105.22 | ▲ Uptrend |
| 2025-08-11 | 103.26 | ▲ Uptrend |
| 2025-08-08 | 103.30 | ▲ Uptrend |
| 2025-08-07 | 100.68 | ▼ Downtrend |
| 2025-08-06 | 104.08 | ▲ Uptrend |
| 2025-08-05 | 103.18 | ▲ Uptrend |
| 2025-08-04 | 101.73 | ▼ Downtrend |
The data suggests a recent recovery, with more uptrend days. Therefore, the stock appears to be in a generally bullish upward trajectory.
Support and Resistance
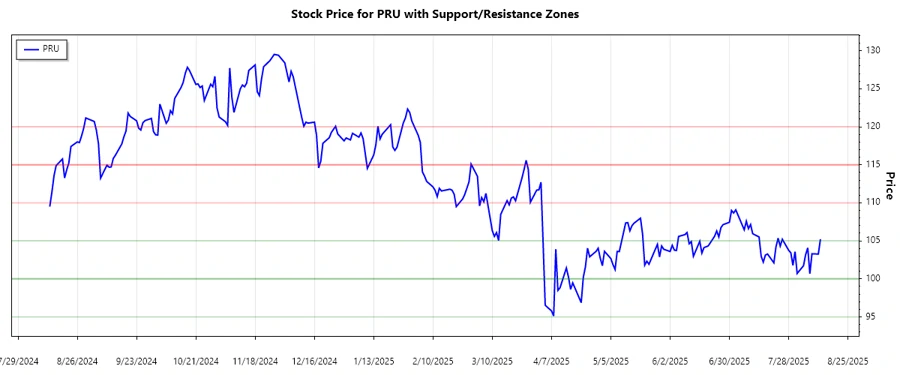
By evaluating historical closing prices, we can identify key support and resistance levels. These zones are critical for understanding potential reversal points or areas of increased trading activity.
| Zone Type | From | To |
|---|---|---|
| Support Zone 1 | 100.00 | 105.00 |
| Support Zone 2 | 95.00 | 100.00 |
| Resistance Zone 1 | 110.00 | 115.00 |
| Resistance Zone 2 | 115.00 | 120.00 |
The current price sits within the first support zone, indicating potential accumulation or a possible breakout in the near term.
Conclusion
Prudential Financial shows promising signs of price strengthening in the short term, with recent price actions indicating a mild bullish trend. The stock currently resides in a critical support zone, highlighting a potential period of consolidation before an upward move towards resistance levels. While the stock's broad market exposure ensures diverse growth opportunities, macroeconomic factors could pose risks. Investors should remain vigilant for potential breakout signals at key resistance levels.
Smart Data Insight
Master the Perfect Entry & Exit for this Stock
Don't leave your profits to chance. Historically, this stock follows specific seasonal patterns that institutional traders use to maximize returns.
- ✅ Identify the "Golden Buying Window"
- ✅ Avoid high-risk correction cycles
- ✅ Backtested data from the last 20+ years