June 12, 2025 a 09:03 am
PRU: Trend and Support & Resistance Analysis - Prudential Financial, Inc.
The recent performance of Prudential Financial, Inc. (PRU) has been marked by noticeable fluctuations, indicative of a volatile market. While the company operates in a stable industry, offering diversified financial services, the stock prices have experienced distinct swings. This analysis will determine trends and highlight crucial support and resistance zones, which are essential for strategic market positioning.
Trend Analysis
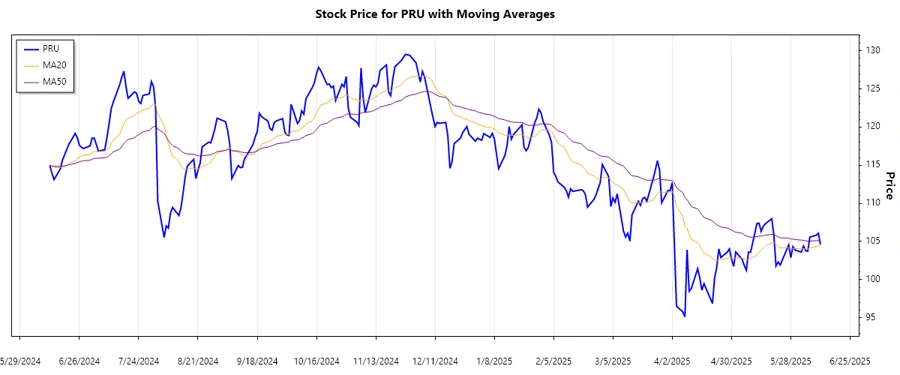
The moving averages provide a clear indication of the stock's trend. The 20-day EMA, calculated from recent closing prices, presents a near-term view of stock momentum, while the 50-day EMA offers a longer-term perspective. In the past several days, the stock showed:
| Date | Closing Price | Trend |
|---|---|---|
| 2025-06-11 | 104.61 | ⚖️ |
| 2025-06-10 | 106.09 | ⚖️ |
| 2025-06-09 | 105.82 | ⚖️ |
| 2025-06-06 | 105.58 | ⚖️ |
| 2025-06-05 | 103.73 | ⚖️ |
| 2025-06-04 | 103.78 | ⚖️ |
| 2025-06-03 | 104.42 | ⚖️ |
The current trend suggests a sideways movement. This indicates a period of market indecision, requiring closer observation for potential breakout signals.
Support and Resistance
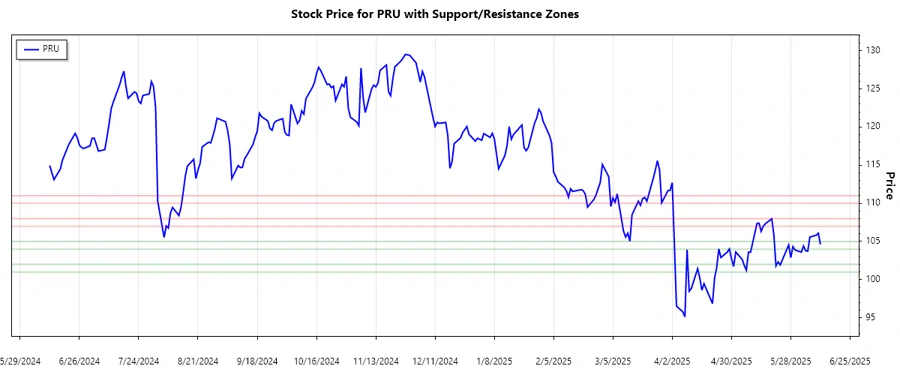
The analysis of support and resistance zones highlights critical price levels:
| Zone | From | To |
|---|---|---|
| Support Zone 1 | 104 | 105 |
| Support Zone 2 | 101 | 102 |
| Resistance Zone 1 | 107 | 108 |
| Resistance Zone 2 | 110 | 111 |
At the moment, the current price is hovering around the Support Zone 1. This positions the stock at a potential turning point, making it critical for traders to watch for a break below or a bounce upward from this level.
Conclusion
Prudential Financial, Inc. is currently experiencing a technical period of indecision with its current price action reflecting a sideways trend. Support and resistance levels are clearly defined, with current prices lingering close to the lower support range, suggesting potential downside risk if a breakout occurs. However, a bounce near these critical areas could present a buying opportunity. The stock's behavior over the coming sessions will be crucial in determining its next significant move, providing both potential opportunities and risks for investors. Analysts should closely monitor external market factors and fundamental developments that may influence this technical setup.
Smart Data Insight
Master the Perfect Entry & Exit for this Stock
Don't leave your profits to chance. Historically, this stock follows specific seasonal patterns that institutional traders use to maximize returns.
- ✅ Identify the "Golden Buying Window"
- ✅ Avoid high-risk correction cycles
- ✅ Backtested data from the last 20+ years