June 30, 2026 a 11:31 am


PRU: Dividend Analysis - Prudential Financial, Inc.
Prudential Financial, Inc. presents a robust dividend profile with a current yield of 5.36% and a rich history of consistent payouts over 25 years. This stability is complemented by a prudent payout strategy, with an EPS-based payout ratio that suggests a sustainable approach to dividends. While the growth in recent years appears moderate, the company demonstrates a commitment to shareholder returns, making it a noteworthy consideration for income-focused investors.
📊 Overview
| Metric | Data |
|---|---|
| Sector | Financial Services |
| Dividend Yield | 5.36% |
| Current Dividend per Share | $5.47 |
| Dividend History | 25 years |
| Last Cut or Suspension | None |
🗣️ Dividend History
The dividend history of Prudential Financial highlights a notable pattern of consistent dividend payments, showcasing reliability and financial robustness. The company's ability to maintain and raise dividends across varying market conditions is a strong indicator of its operational success and financial health.
| Year | Dividend per Share (USD) |
|---|---|
| 2026 | $2.80 |
| 2025 | $5.40 |
| 2024 | $5.20 |
| 2023 | $5.00 |
| 2022 | $4.80 |
📈 Dividend Growth
The analysis of dividend growth is crucial to understanding the future potential of income streams from investments. Prudential Financial shows steady growth, reflecting its capability to increment shareholder returns sustainably.
| Time | Growth |
|---|---|
| 3 years | 4.00% |
| 5 years | 4.18% |
The average dividend growth is 4.18% over 5 years. This shows moderate but steady dividend growth.
✅ Payout Ratio
The payout ratio is indicative of dividend safety, measuring the proportion of earnings paid out as dividends. Prudential Financial's payout ratios enable investors to assess the sustainability of its dividends.
| Key Figure | Ratio |
|---|---|
| EPS-based | 54.92% |
| Free Cash Flow-based | 19.43% |
The EPS payout ratio of 54.92% suggests a well-balanced approach, allowing room for reinvestment, while the FCF payout of 19.43% indicates financial flexibility.
🔍 Cashflow & Capital Efficiency
Cash flow stability and capital efficiency are pivotal in evaluating a company's long-term financial resilience. Prudential Financial showcases commendable metrics that highlight operational efficacy.
| Metrics | 2023 | 2024 | 2025 |
|---|---|---|---|
| Free Cash Flow Yield | 25.80% | 20.06% | 15.79% |
| Earnings Yield | 9.13% | 6.44% | 9.01% |
| CAPEX to Operating Cash Flow | 0% | 0% | 0% |
| Stock-based Compensation to Revenue | 0% | 0% | 0% |
| Free Cash Flow / Operating Cash Flow Ratio | 1 | 1 | 1 |
The consistently high free cash flow yield supports the firm's robust capital efficiency and ability to cover its dividend payments comfortably.
💼 Balance Sheet & Leverage Analysis
A healthy balance sheet and manageable leverage are crucial indicators of financial stability and liquidity. Prudential Financial’s metrics in these areas demonstrate substantial stability and sensible financial management.
| Metrics | 2023 | 2024 | 2025 |
|---|---|---|---|
| Debt-to-Equity | 0.97 | 1.02 | 0.71 |
| Debt-to-Assets | 0.04 | 0.04 | 0.03 |
| Debt-to-Capital | 0.49 | 0.50 | 0.41 |
| Net Debt to EBITDA | 2.50 | 2.75 | 0.66 |
| Current Ratio | 1.80 | 1.87 | 0.61 |
| Quick Ratio | 1.80 | 1.87 | 0.61 |
| Financial Leverage | 25.92 | 26.39 | 23.85 |
The metrics reflect a solid balance between leveraging financial advantages and maintaining a conservative approach to debt management.
📉 Fundamental Strength & Profitability
Profitability and fundamental strength are crucial for sustaining competitive advantages and ensuring long-term efficiency. These metrics provide insights into how effectively the company deploys its resources.
| Metrics | 2023 | 2024 | 2025 |
|---|---|---|---|
| Return on Equity | 8.94% | 9.78% | 11.02% |
| Return on Assets | 0.35% | 0.37% | 0.46% |
| Net Margin | 4.58% | 3.86% | 5.88% |
| EBIT Margin | 5.66% | 4.54% | 7.87% |
| EBITDA Margin | 5.53% | 5.08% | 8.08% |
| Gross Margin | 32.35% | 24.79% | 42.04% |
| R&D to Revenue | 0% | 0% | 0% |
The figures illustrate Prudential Financial's adeptness at harnessing profitability while also reinvesting strategically for future growth.
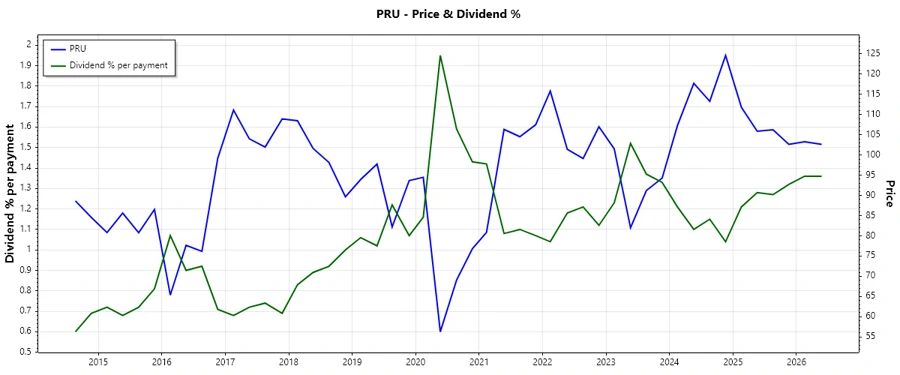
💹 Price Development
📊 Dividend Scoring System
| Criteria | Score | Score Bar |
|---|---|---|
| Dividend Yield | 5 | |
| Dividend Stability | 4 | |
| Dividend Growth | 3 | |
| Payout Ratio | 4 | |
| Financial Stability | 4 | |
| Dividend Continuity | 4 | |
| Cashflow Coverage | 5 | |
| Balance Sheet Quality | 3 |
Total Score: 32/40
🔍 Rating
In conclusion, Prudential Financial, Inc. maintains a strong and reliable dividend profile, underscored by its solid financial metrics and strategic approach to sustainable payout growth. The stock is a compelling addition for investors seeking consistent income, backed by a financially stable entity. Investing in Prudential Financial offers potential for both growth and income, making it a well-rounded choice for dividend-focused portfolios.
Smart Data Insight
Master the Perfect Entry & Exit for this Stock
Don't leave your profits to chance. Historically, this stock follows specific seasonal patterns that institutional traders use to maximize returns.
- ✅ Identify the "Golden Buying Window"
- ✅ Avoid high-risk correction cycles
- ✅ Backtested data from the last 20+ years