January 26, 2026 a 03:31 am

PRU: Dividend Analysis - Prudential Financial, Inc.
Prudential Financial, Inc. offers a compelling dividend profile with a substantial dividend yield of 5.26%. The company has a stable dividend history spanning 24 years, with no cuts since 2008. This consistency is a strong indicator of reliability for income-focused investors. Analysts can take comfort in its historically steady dividend payout, although the relatively high payout ratio may cause prudence in times of financial strain.
📊 Overview
| Attribute | Value |
|---|---|
| Sector | Financial Services |
| Dividend yield | 5.26% |
| Current dividend per share | 5.29 USD |
| Dividend history | 24 years |
| Last cut or suspension | 2008 |
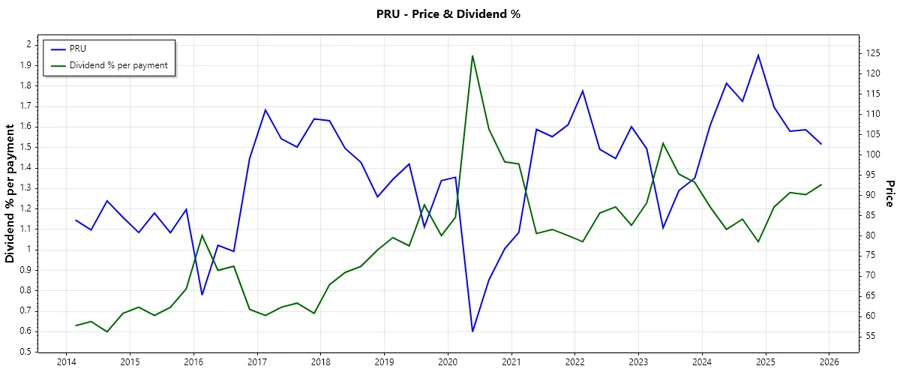
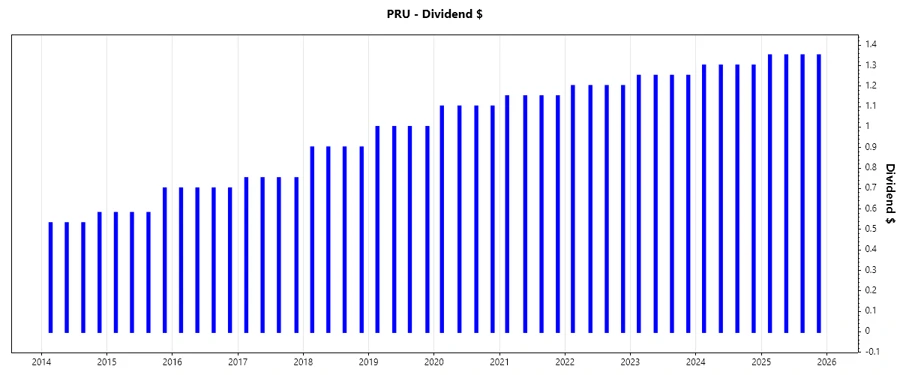
🗣️ Dividend History
The dividend history of Prudential Financial demonstrates a resilient commitment to shareholders, with consistent dividend growth over the years. This historical stability assures investors of the company’s capacity to return capital back to its shareholders.
| Year | Dividend Per Share (USD) |
|---|---|
| 2025 | 5.40 |
| 2024 | 5.20 |
| 2023 | 5.00 |
| 2022 | 4.80 |
| 2021 | 4.60 |
📈 Dividend Growth
Dividend growth analysis reveals slow but steady increases in dividends, with a 3-year growth rate of 4.00% and a 5-year growth rate of 4.18%. This gradual growth suggests a cautious but stable financial strategy, positively impacting long-term investor returns.
| Time | Growth |
|---|---|
| 3 years | 4.00% |
| 5 years | 4.18% |
The average dividend growth is 4.18% over 5 years. This shows moderate but steady dividend growth.
⚠️ Payout Ratio
Payout ratios are critical indicators of dividend sustainability. Prudential’s EPS-based payout ratio at 71.05% is relatively high, indicating a significant proportion of earnings are distributed as dividends. Meanwhile, the free cash flow-based payout ratio of 35.30% presents a more conservative and sustainable distribution scope from cash flows.
| Key Figure | Ratio |
|---|---|
| EPS-based | 71.05% |
| Free cash flow-based | 35.30% |
Prudential’s payout ratio suggests a reliance on earnings for dividend distribution, which may be precarious during financial downturns but remains within acceptable industry norms for sustainability.
✅ Cashflow & Capital Efficiency
Analyzing cash flow and capital efficiency can provide insight into operational performance and fiscal management effectiveness. A strong Free Cash Flow Yield of 13.92% in 2022 escalated to 20.06% in 2024, indicating improved cash generation relative to equity value, enhancing shareholder returns.
| Metric | 2022 | 2023 | 2024 |
|---|---|---|---|
| Free Cash Flow Yield | 13.92% | 17.27% | 20.06% |
| Earnings Yield | -4.45% | 6.60% | 6.44% |
| CAPEX to Operating Cash Flow | 0% | 0% | 0% |
| Stock-based Compensation to Revenue | 0.39% | 0% | 0% |
| Free Cash Flow / Operating Cash Flow Ratio | 100% | 100% | 100% |
Prudential demonstrates strong cash flow stability and high capital efficiency, affording it robust capabilities to manage and finance its operational strategy effectively.
📉 Balance Sheet & Leverage Analysis
Leverage ratios indicate prudence in debt management, showcasing stability across financial measures. The Debt-to-Equity ratio decreased from 69% in 2022 to 77% in 2024, with a manageable Debt-to-Capital ratio reinforcing a disciplined capital structure.
| Metric | 2022 | 2023 | 2024 |
|---|---|---|---|
| Debt-to-Equity | 68.83% | 75.03% | 77.39% |
| Debt-to-Assets | 2.93% | 2.89% | 2.93% |
| Debt-to-Capital | 40.77% | 42.87% | 43.63% |
| Net Debt to EBITDA | -214.42% | 48.47% | 85.55% |
| Current Ratio | 0% | 0% | 0% |
| Quick Ratio | 0% | 0% | 0% |
| Financial Leverage | 22.52 | 25.92 | 26.39 |
Prudential’s balanced leverage strategy supports financial resilience, maintaining liquidity and ensuring capability to address liabilities.
🗣️ Fundamental Strength & Profitability
Evaluation of profitability and fundamental strength reveals performance fluctuations but highlights progress in return metrics. Notably, the Return on Equity jumped from a deficit in 2022 to 9.78% in 2024, emphasizing regained profitability.
| Metric | 2022 | 2023 | 2024 |
|---|---|---|---|
| Return on Equity | -5.38% | 8.94% | 9.78% |
| Return on Assets | -0.24% | 0.34% | 0.37% |
| Return on Invested Capital | -150.87% | 2.83% | 2.25% |
| Net Profit Margin | -2.89% | 4.58% | 3.86% |
| EBIT Margin | -3.32% | 5.66% | 4.54% |
| EBITDA Margin | -3.11% | 5.53% | 5.08% |
| Gross Margin | 20.86% | 32.35% | 24.79% |
| R&D to Revenue | 0% | 0% | 0% |
The improvement across profitability metrics signals a strengthening operational foothold, driven by strategic refinements and optimal resource utilization.
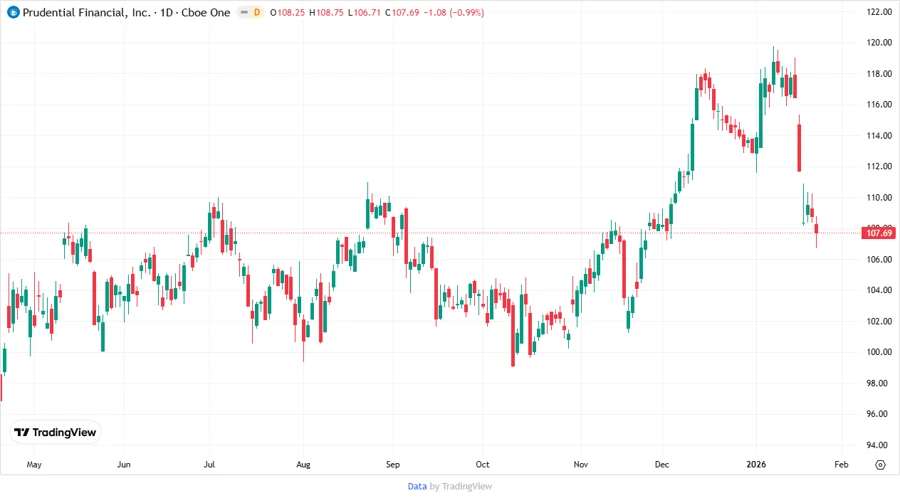
📈 Price Development
✅ Dividend Scoring System
| Criterion | Score | Indicator |
|---|---|---|
| Dividend yield | 5 | |
| Dividend Stability | 4 | |
| Dividend growth | 3 | |
| Payout ratio | 3 | |
| Financial stability | 4 | |
| Dividend continuity | 5 | |
| Cashflow Coverage | 4 | |
| Balance Sheet Quality | 4 |
Total Score: 32/40
🗣️ Rating
Prudential Financial, Inc. scores a strong 32 out of 40 in our Dividend Scoring System. With an impressive dividend yield and solid dividend continuity, Prudential holds promise for income-focused portfolios. However, its high payout ratio requires monitoring in fluctuating market conditions. Overall, it stands as a robust choice for investors seeking stable income sources with calculated risk.