December 07, 2025 a 03:31 am

PRU: Dividend Analysis - Prudential Financial, Inc.
Prudential Financial, Inc. offers a robust dividend profile that may appeal to income-focused investors. With a consistent dividend history over 24 years and a notable dividend yield of 5.26%, the company demonstrates its commitment to returning capital to shareholders. However, potential investors should be aware of the relatively high payout ratio, indicating cautious optimism. Historical growth trends suggest moderate but steady increases in dividends.
📊 Overview
| Aspect | Details |
|---|---|
| Sector | Financial Services |
| Dividend yield | 5.26% |
| Current dividend per share | 5.29 USD |
| Dividend history | 24 years |
| Last cut or suspension | 2008 |
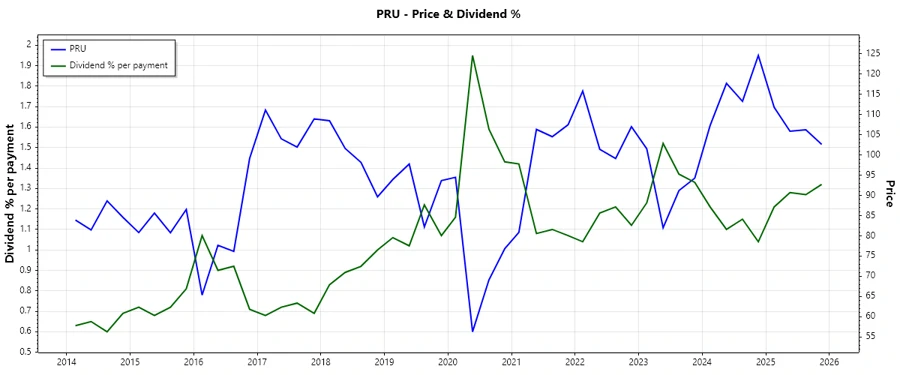
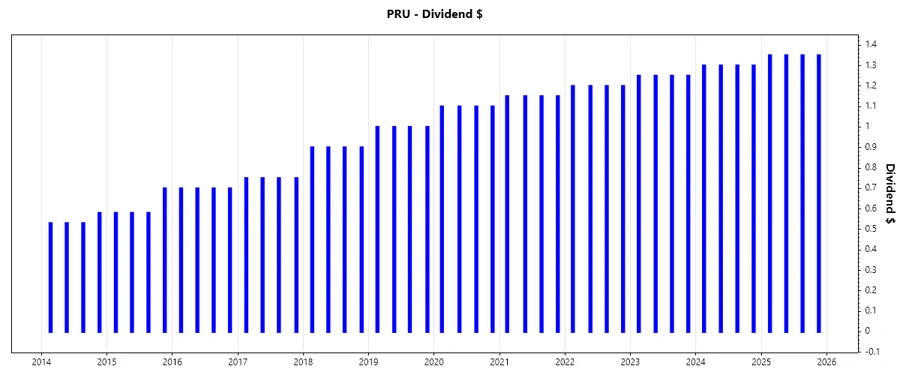
🗣️ Dividend History
The dividend history of Prudential Financial, Inc. reflects its longstanding commitment to shareholders, indicating a stable and reliable income stream. Such history is critical for evaluating the trustworthiness of dividend payments, especially during volatile markets.
| Year | Dividend Per Share (USD) |
|---|---|
| 2025 | 5.40 |
| 2024 | 5.20 |
| 2023 | 5.00 |
| 2022 | 4.80 |
| 2021 | 4.60 |
📈 Dividend Growth
Examining the dividend growth provides insights into the company's ability to increase shareholder returns over time, indicating future performance potential and financial health.
| Time | Growth |
|---|---|
| 3 years | 4.17% |
| 5 years | 5.39% |
The average dividend growth is 5.39% over 5 years. This shows moderate but steady dividend growth.
✅ Payout Ratio
The payout ratio is a crucial measure of a company's ability to sustain its dividends. Prudential Financial's payout ratio based on EPS and Free Cash Flow signifies the portion of earnings and cash flow distributed to shareholders, balancing reinvestment and debt servicing.
| Key figure | Ratio |
|---|---|
| EPS-based | 71.05% |
| Free cash flow-based | 35.44% |
The EPS-based payout ratio of 71.05% suggests a prudent yet aggressive dividend policy, maintaining an adequate margin for financial contingencies. Conversely, a 35.44% FCF-based payout is indicative of solid cash flow management.
📊 Cashflow & Capital Efficiency
Understanding cash flow metrics and capital efficiency helps in assessing the sustainability of the dividend and overall financial health of the corporation.
| Aspect | 2024 | 2023 | 2022 |
|---|---|---|---|
| Free Cash Flow Yield, Earnings Yield | 20.06%, 6.44% | 17.27%, 6.60% | 13.93%, -4.45% |
| CAPEX to Operating Cash Flow | 0 | 0 | 0 |
| Stock-based Compensation to Revenue | 0 | 0 | 0.39% |
| Free Cash Flow / Operating Cash Flow Ratio | 1 | 1 | 1 |
The analysis indicates effective capital allocation with a consistent free cash flow yield ratio, reflecting efficient operations that support shareholder payouts.
📊 Balance Sheet & Leverage Analysis
A thorough analysis of balance sheet and leverage ratios is vital to understand the debt levels and financial stability of the company.
| Aspect | 2024 | 2023 | 2022 |
|---|---|---|---|
| Debt-to-Equity, Debt-to-Assets, Debt-to-Capital | 0.77, 0.03, 0.44 | 0.75, 0.03, 0.43 | 1.30, 0.03, 0.56 |
| Net Debt to EBITDA | 0.86 | 0.49 | -2.14 |
| Current Ratio, Quick Ratio, Financial Leverage | 14.59, 5.74, 26.39 | 0, 1.94, 25.92 | 0, 22.81, 42.46 |
The moderate levels of debt suggest good financial leverage management, with an emphasis on maintaining liquidity with high current and quick ratios, ensuring financial safety and potential for strategic expansion.
📊 Fundamental Strength & Profitability
Assessing fundamental strength and profitability ratios highlights the company’s efficiency in generating profits relative to its resources.
| Aspect | 2024 | 2023 | 2022 |
|---|---|---|---|
| Return on Equity, Return on Assets | 9.78%, 0.37% | 8.94%, 0.35% | -10.14%, -0.24% |
| Margins: Net, EBIT, EBITDA, Gross | 3.86%, 4.54%, 5.08%, 24.76% | 4.58%, 5.66%, 5.53%, 32.35% | -2.89%, -3.32%, -3.12%, 20.83% |
| Research & Development to Revenue | 0 | 0 | 0 |
The profitability ratios indicate a strong return profile with highly efficient operational management, despite some historical volatility.
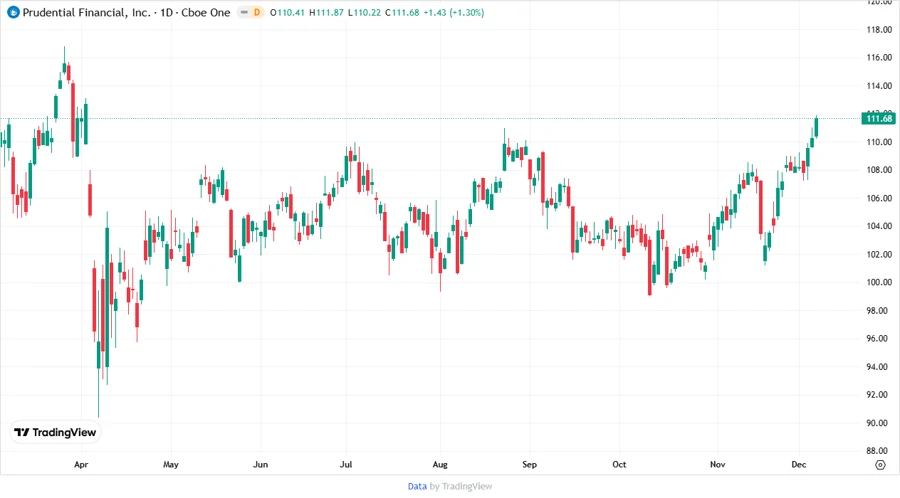
📊 Price Development
📋 Dividend Scoring System
| Criteria | Score | Score Bar |
|---|---|---|
| Dividend yield | 4 | |
| Dividend Stability | 5 | |
| Dividend growth | 3 | |
| Payout ratio | 3 | |
| Financial stability | 4 | |
| Dividend continuity | 5 | |
| Cashflow Coverage | 4 | |
| Balance Sheet Quality | 4 |
Total Score: 32/40
📉 Rating
Based on the comprehensive analysis, Prudential Financial, Inc. maintains a strong dividend profile supported by solid financial metrics and strategic capital allocation. The company is well-positioned to continue rewarding shareholders, though potential investors should consider the maturity of the industry and inherent market risks. Overall, Prudential Financial, Inc. is a favorable option for dividend-seeking investors with a risk-tolerant outlook.